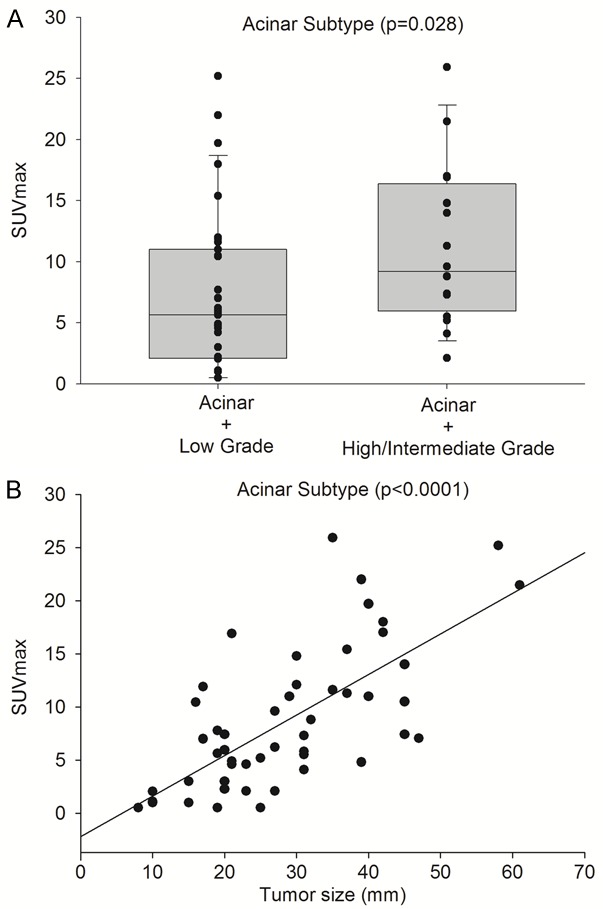
Figure 3.

Acinar predominant subtype accompanied by a second growth pattern intermediate or high grade showed higher SUVmax (11.1±6.6) than acinar subtype accompanied by a second low grade growth pattern (7.2±6.5), P=0.028 (A). SUVmax in the acinar predominant subtype showed the strongest correlated with tumor dimensions (B).
