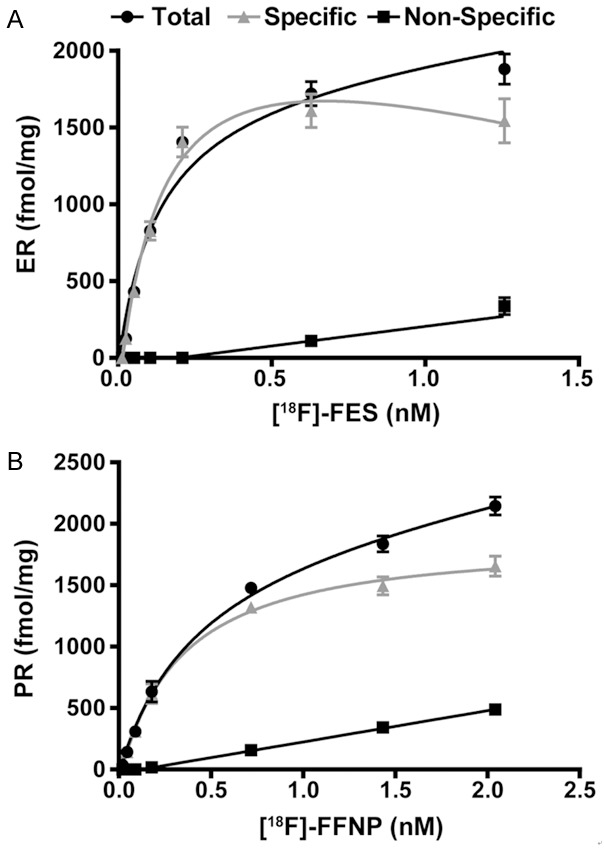
Figure 4.

Saturation binding curves yield Kd and Bmax for [18F]FES and [18F]FFNP. Steroid hormone deprived ER+ MCF-7 (A) and PR+ T47D (B) cells were seeded in identical 24-well plates treated with 0.002-0.22 MBq (0.06-6 μCi) [18F]FES and 0.004-0.42 MBq (0.11-11.4 μCi) [18F]FFNP for 1 h, respectively. Total binding, non-specific, and specific binding (total binding minus non-specific binding) are shown. Values represent the mean ± standard error of three independent experiments performed in triplicate.
