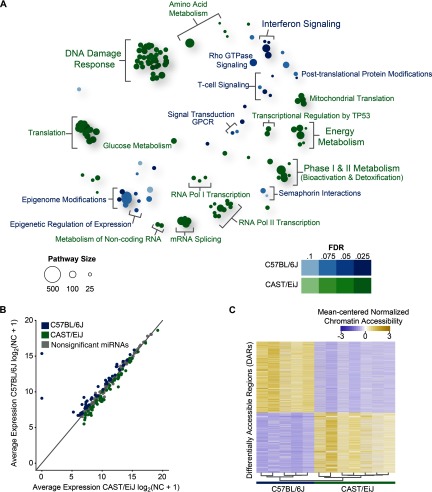
Figure 1.
Strain-specific transcriptome dynamics, microRNA (miRNA) profiles, and chromatin accessibility in the mouse lung without exposure to 1,3-butadiene. (A) Bubble plot showing enriched reactome pathways for differentially expressed genes more highly expressed in CAST/EiJ control mice compared with those more highly expressed in C57BL/6J control mice. For each pathway, significance is represented by shading, and the number of genes in each pathway is represented by bubble size. For clarity, groups of related pathways are labeled with a general descriptive term as opposed to individual pathway names. A false discovery rate was used to determine significance, but owing to the number of significant pathways, only the top 105 pathways in either direction are shown (see Excel Table S3 for a complete list). (B) Average expression of miRNAs in CAST/EiJ control (x-axis) compared with C57BL/6J control (y-axis). Expression values are based on normalized counts (NC). (C) Differentially accessible regions (DARs) identified using assay for transposase accessible chromatin (ATAC)-seq (, windows) exhibit distinct profiles in CAST/EiJ and C57BL/6J. Hierarchical clustering of samples is represented by a dendrogram. (D) Representative loci for DARs (asterisks) between CAST/EiJ control and C57BL/6J control.


