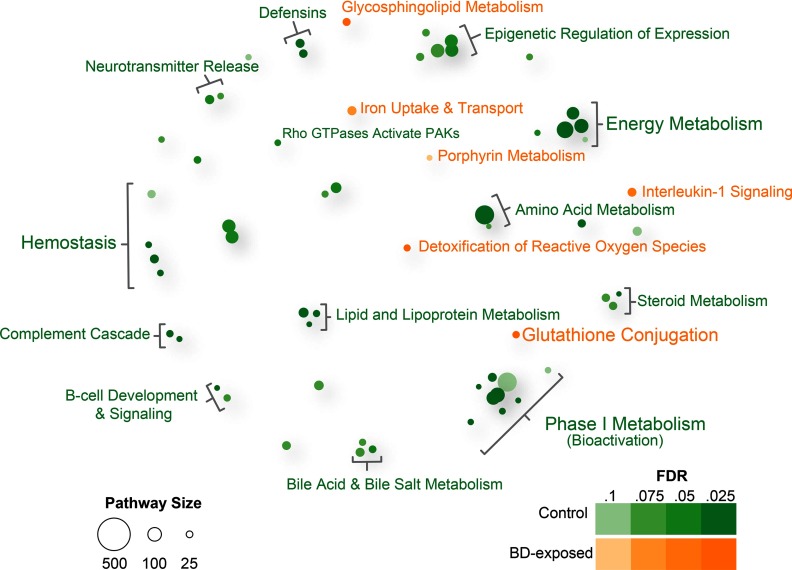
Figure 2.
Enriched reactome pathways for differentially expressed genes in lung tissue of 1,3-butadiene-exposed versus control CAST/EiJ mice. Bubble plot showing enriched reactome pathways for differentially expressed genes up-regulated in CAST/EiJ control or up-regulated in CAST/EiJ exposed to 1,3-butadiene (BD) at a false discovery rate . For each pathway, significance is represented by shading of the bubble, and the number of genes in each pathway is represented by bubble size. For clarity, groups of related pathways are labeled with a general descriptive term as opposed to individual pathway names (see Excel Table S7 for complete list). Neither microRNAs (miRNAs) nor differentially accessible regions (DARs) were differentially expressed in 1,3-butadiene versus control CAST/EiJ mice at an (data not shown).

