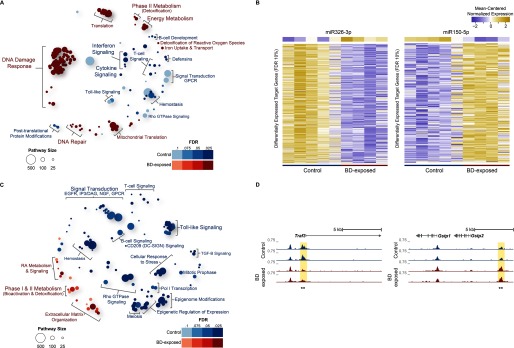
Figure 3.
Enriched reactome pathways for differentially expressed genes in lung tissue of 1,3-butadiene–exposed versus control C57BL/6J mice. (A) Bubble plot showing enriched reactome pathways for differentially expressed genes up-regulated in C57BL/6J control mice or up-regulated in C57BL/6J mice exposed to 1,3-butadiene (BD) at a false discovery rate . For each pathway, significance is represented by bubble shading, and the number of genes in each pathway is represented by bubble size. For clarity, groups of related pathways are labeled with a general descriptive term as opposed to individual pathway names. The top 105 pathways in either direction are shown (see Excel Table S8 for complete list). (B) miR-326-3p is a significant regulatory hub (miRHub, ) and is up-regulated in C57BL/6J in response to 1,3-butadiene (BD) exposure. The predicted messenger RNA (mRNA) targets of miR-326-3p are down-regulated in response to exposure. miR-150-5p is also a significant regulatory hub (miRHub, ) but was down-regulated in C57BL/6J in response to exposure. The predicted mRNA targets of miR-150-5p were subsequently up-regulated following exposure. (C) Bubble plot showing enriched reactome pathways for differentially accessible regions (DARs) up-regulated in C57BL/6J control or up-regulated in C57BL/6J exposed mice at an . For each pathway, significance is represented by bubble shading, and the number of genes in each pathway is represented by bubble size. For clarity, groups of related pathways are labeled with a general descriptive term as opposed to individual pathway names. Only the top 105 pathways in either direction are shown (see Excel Table S9 for complete list). (D) Representative loci for DARs (asterisks) between C57BL/6J control and C57BL/6J exposed mice.

