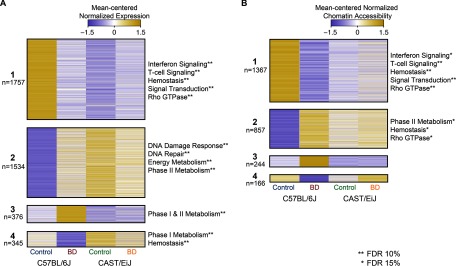
Figure 5.
Mean-centered normalized gene expression and chromatin assembly for enriched pathways according to exposure and strain. (A) Heat map of mean-centered normalized expression for genes that were differentially expressed in C57BL/6J mice following 1,3-butadiene (BD) exposure across all strains and conditions. Genes are divided into four groups based on their overall pattern of expression (see Excel Table S2 for genes in each group). For clarity, significantly enriched pathways within each group are represented by a general descriptive term (asterisks denote the significance cut-off for each pathway as indicated on the figure) as opposed to individual pathway names (see Excel Table S10 for a complete list of pathways). (B) Heat map of mean-centered normalized chromatin accessibility for regions that were differentially accessible in C57BL/6J mice following exposure across all strains and conditions. Regions are divided into four groups based on their overall pattern of accessibility (see Excel Table S5 for regions in each group). For clarity, significantly enriched pathways within each group are represented by a general descriptive term as opposed to individual pathway names (see Excel Table S10 for a complete list). FDR, false discovery rate.

