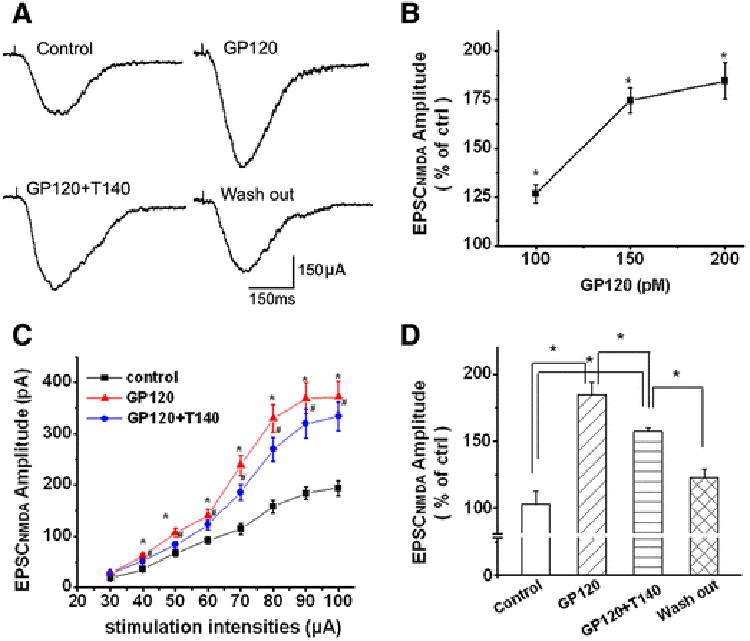
Figure 3. Gp120 enhancement of EPSCNMDAR via CXCR4.

A. Exemplary whole-cell current traces illustrating gp120 (200pM) increase of EPSCNMDAR recorded from a CA1 neuron in a rat hippocampal slice before (Ctrl), during bath perfusion of gp120 (gp120), gp120+T140 (50nM) (gp120+T140), or after washout of gp120+T140 (washout). Note that bath application of gp120 produced an increase of EPSCNMDAR (upper right), addition of T140 to the bath partially inhibited gp120-induced increase of EPSCNMDAR (lower left) and the EPSCNMDAR returned to the control level after washout of gp120 +T140 (lower right). B. A dose-responsive curve showing that gp120 increased EPSCNMDAR in a dose-dependent manner. C. The input/output curve shows that gp120 significantly increased the amplitude of EPSCNMDAR evoked by an electric stimulation on Schaffer collateral fibers with different intensities (30μA∼100μA) and that the gp120-induced increase of the EPSCNMDAR amplitudes were partially inhibited by T140 (n=9, * p<0.05 vs ctrl, #p<0.05 vs gp120. D. Bar graph shows the average of normalized EPSCNMDAR amplitudes measured before (Ctrl), during bath application of gp120 (gp120), during bath application of gp20+T140 (GP120+T140), or after washout of gp120+T140 (washout). Values are the means ± SEM, n=9, *p<0.05 as determined by one-way ANOVA.
