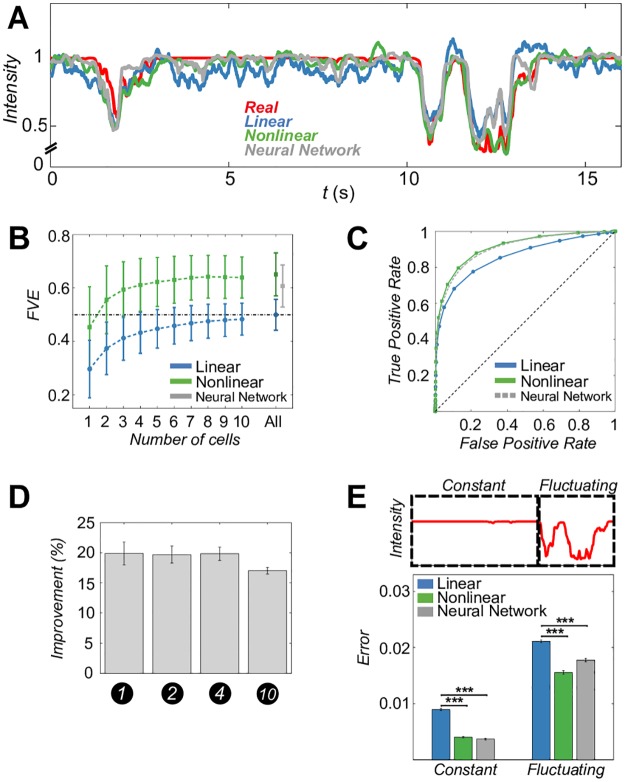
Fig 2. Nonlinear decoding outperforms linear decoding.
A: Luminance trace (red) with linear (blue) and nonlinear KRR (green) and neural network (grey) predictions. B: Average decoder performance (± SD across sites), achievable using increasing numbers of cells with highest L1 filter norm. For nonlinear decoding, “All” is the optimal subset that maximizes performance (S7 Fig). Since the neural network (grey point with an error bar) simultaneously decodes the movie at all sites, it only makes sense to train it using “All” cells. C: Average ROC across all testing movie frames. D: Fractional improvement (average ± SEM across sites) of nonlinear KRR versus linear decoders for test stimuli with different numbers of discs. All decoders were trained only on the 10-disc stimulus. E: Decoding error (MSE; average ± SEM across sites) in fluctuating and constant epochs is significantly larger for linear decoders (p<0.001) relative to nonlinear KRR and the neural network.

