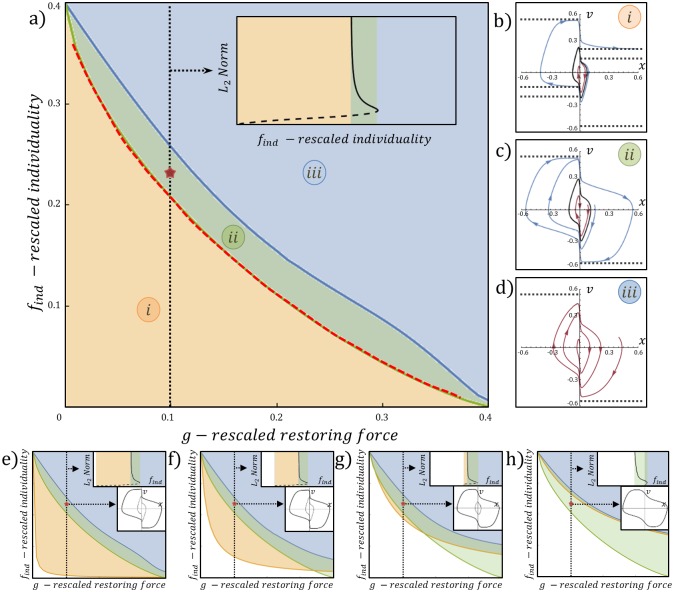
Fig 2. Stability analysis.
(A) The find − g phase diagram for ϵ → 0. Green line refers to the homoclinic bifurcation (Eq (12)). Blue line refers to the saddle node bifurcation. Top right inset displays the bifurcation diagram of find along the dashed section where g = 0.1: find against the (x, v) vector norm of the solution (), solid black line is the stable limit cycle and the dashed black line is the separatrix. Red marker refers to the point (g, find) = (0.1, 0.23). Red dashed line is the numerical estimation of the homoclinic bifurcation obtained using AUTO-07P [28]. (B-D) The {x, v} phase space portraits for phases (i), (ii), (iii), corresponding to the points (g, find) = (0.1, 0.18), (0.1, 0.23), (0.1, 0.28) respectively. Black dashed lines display the q(x, v) = 0 nullcline solutions. Black solid line display the separatrix. Red line display convergent flow. Blue line display free/oscillatory motion. (E-H) find − g phase diagrams for ϵ = 0.001, 0.01, 0.05, 0.1 respectively. Orange line refers to the subcritical hopf bifurcation (Eq (10)). Green line refers to the homoclinic bifurcation (Eq (12)). Blue line refers to the saddle node bifurcation. Top right inset displays the bifurcation diagram of the dashed section line where g = 0.1. Middle right inset display the {x, v} phase space portrait that correspond to point (g, find) = (0.1, 0.23) represented by the red marker. In the middle insets, the solid/dashed black lines are the stable/unstable limit cycles. Other parameters used to produce the diagrams are in Table 1.

