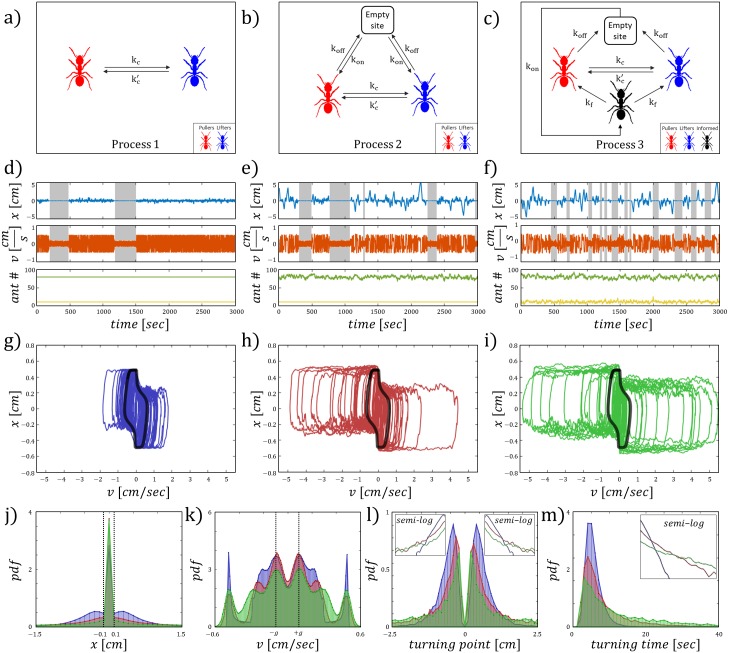
Fig 3. The stochastic process schemes.
(A-C) Illustrations of the kinetics used in the simulations. (D-F) The dynamics of the three processes respectively. Upper panel is the time series of the position. Middle panel is the time series of the velocity. The gray sections cover the parts of the time series where the system is in a convergent mode of motion. Bottom panel shows the time series of the ant population on the cargo. Green/yellow represent the uninformed/informed ants respectively. (G-I) The {x, v} phase space trajectories for the three processes. Black solid line is the deterministic solution. (J) The position distributions, black dashed lines at ±0.1 are the thresholds for detecting convergence. (K) The velocity distributions, black dashed lines at ±g are the thresholds for detecting convergence. (L) The turning point distributions, upper panels display the semi-log plot of the probability density function for each half space of x. (M) The turning time distributions, upper right panel display the semi-log plot of the probability density function. Color index: Blue, red, green—processes 1, 2, 3 respectively.

