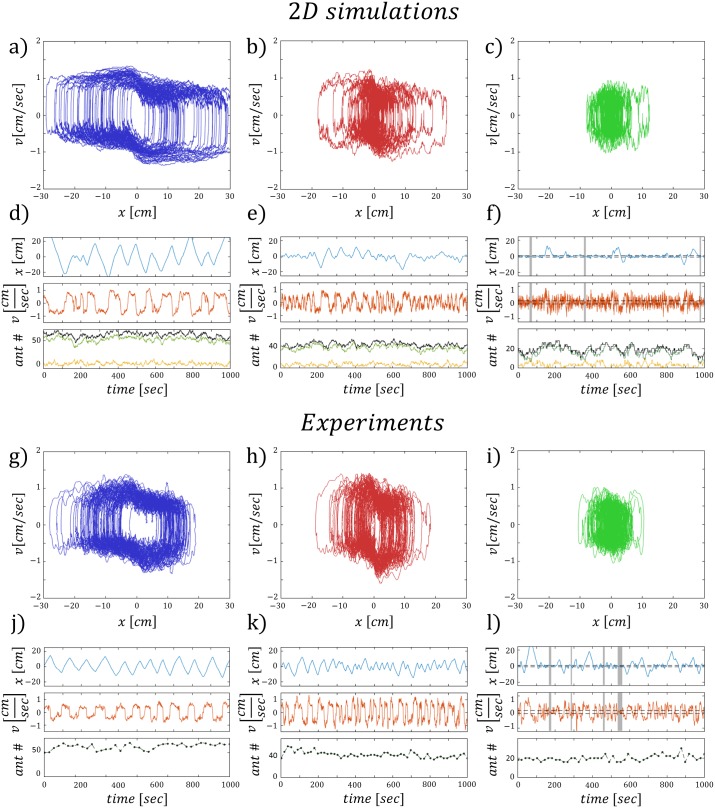
Fig 5. Experiments and two dimensional simulations.
2D Simulations: (A-C) {x, v} phase space trajectories for the motion of the three cargoes. (D-F) Cargo dynamics. Upper panel displays the position time series. Middle panel displays the velocity time series, gray sections cover the convergent mode of motion. Black dashed lines indicate the thresholds for detecting convergence. Bottom panel displays the time series of the ant population on the cargo. Green/yellow represent the uninformed/informed ants respectively. Black is the total number of ants carrying the cargo. Experiments: (G-I) {x, v} phase space trajectories for the motion of the three cargoes. (J-L) Cargo dynamics. Upper panel displays the position time series. Middle panel displays the velocity time series, gray sections cover the convergent mode of motion. Black dashed lines indicate the thresholds for detecting convergence. Bottom panel display the time series of the ant population on the cargo. Parameters for the simulations are given in Table 1. Color index: Blue, red, green—large, medium, small cargoes (R = 2, 1, 0.5 [cm]) respectively.

