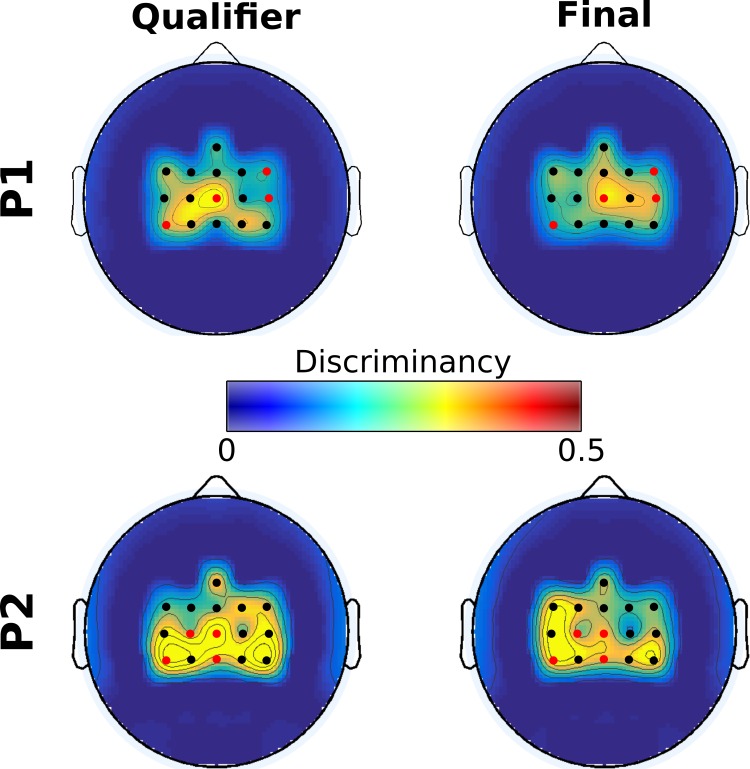
Fig 5. BCI feature discriminancy for pilots P1 and P2 in the Cybathlon.
Topographic maps of discriminancy per Cybathlon race on the 16 EEG channel locations over the sensorimotor cortex monitored. Bright color indicates high discriminancy between Both Hands and Both Feet MI tasks employed by both pilots. The discriminancy of each channel is quantified as the Fisher score of the EEG signal's power spectral density distributions for these two mental classes in the high β band (22–32 Hz), on this channel. Each map illustrates local Fisher scores (with interchannel interpolation) in the supertitled race. Selected channels are indicated by red color. Fig 5 data is located at https://doi.org/10.5281/zenodo.1205711. BCI, brain–computer interface; EEG, electroencephalography; MI, motor imagery.

