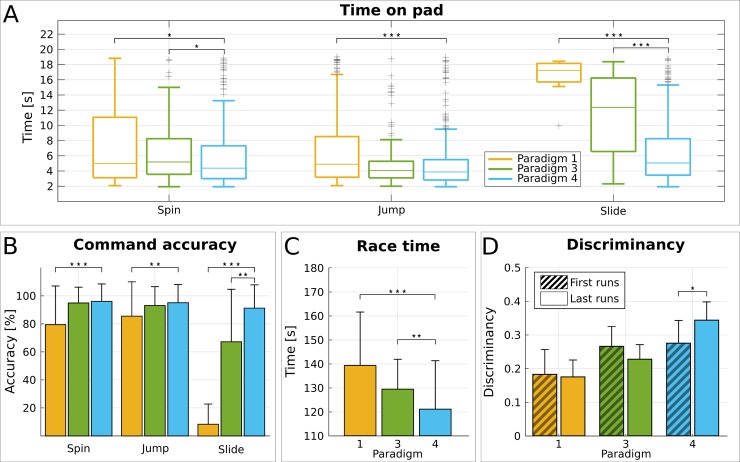
Fig 6. Effects of the control paradigm.
(A) Boxplots of pad crossing time (s) for pilot P1 and all pad types (spin, jump, slide) and control paradigms 1 (yellow), 3 (green), and 4 (cyan). The box edges signify the 75th (top) and 25th (bottom) percentiles and the colored horizontal line the median of the corresponding distribution. The whiskers extend to the largest and smallest nonoutlier values. Outliers are marked with black crosses. (B) Average and standard deviation of BCI command accuracy (in percent) for pilot P1 and all command types (spin, jump, slide) and control paradigms 1 (yellow), 3 (green), and 4 (cyan). (C) Average and standard deviation of race completion time (s) for pilot P1 and control paradigms 1 (yellow), 3 (green), and 4 (cyan). (D) Average and standard deviation of overall feature discriminancy (medial and lateral locations) in the first and last 10 runs for pilot P1 and control paradigm 1 (yellow), 3 (green), and 4 (cyan). Statistically significant differences are shown with two-sided Wilcoxon ranksum tests (for the sake of clarity, only with respect to paradigm 4). (*): p < .05, (**): p < .01, (***): p < .001. Fig 6 data is located at https://doi.org/10.5281/zenodo.1205810, https://doi.org/10.5281/zenodo.1205818, https://doi.org/10.5281/zenodo.1205822, https://doi.org/10.5281/zenodo.1205828. BCI, brain–computer interface.

