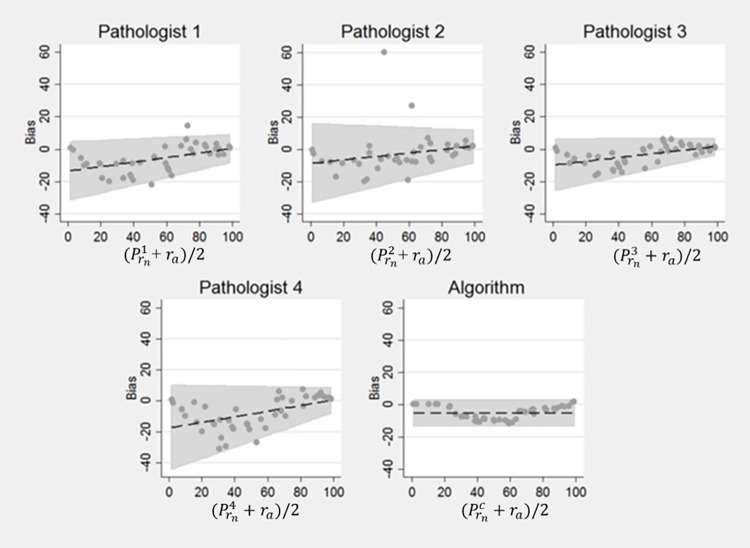
Fig 4. Bland Altman Plots for ra.
The absolute bias and the variability of the pathologists’ estimates of ra decreased with the increasing percentage of positive nuclei. This shows that for images with higher concentrations of positive nuclei, pathologists’ estimates deviate from accuracy in ways that are not present in the algorithm’s estimates.

