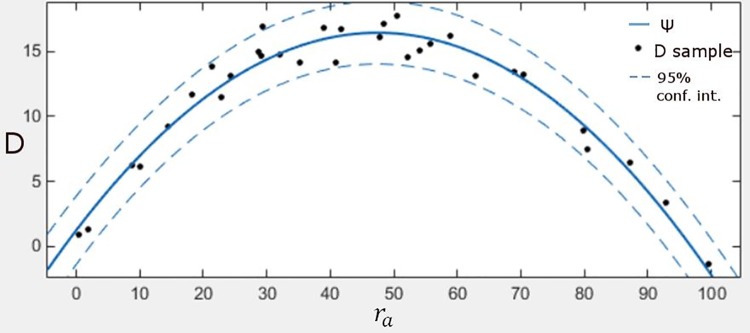
Fig 6. The plot shows a function which facilitates the mapping of ra → rn.
The horizontal axis corresponds to different values of ra while the vertical axis represents D, i.e. error. Each individual dot represents the error between ra and rn for the training images. The solid line corresponds to the mapping function Ψ which facilitates the mapping of ra to rn while the dotted lines represent the confidence interval.

