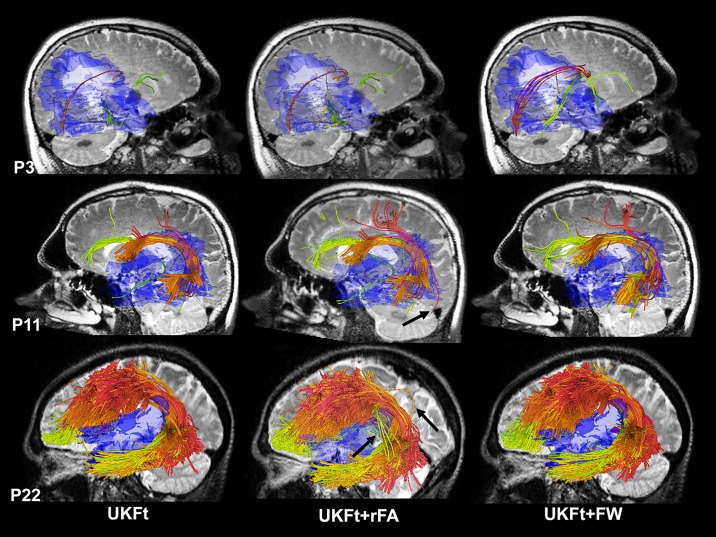
Fig 2. Automatically detected arcuate fasciculus tract clusters in example datasets from patients with edema.
Views are from left or right based on the involvement with edema, using the UKFt, UKFt+rFA and UKFt+FW methods of P3, P11, P22. A T2-weighted image is shown behind the fiber tracts. Edema is shown in transparent blue. Tract colors indicate individual fiber clusters as defined in the atlas. For the UKFt+rFA method, the FA thresholds were set to 0.03, 0.07 and 0.07 for the three cases, respectively, to achieve the most similar AF volumes to those obtained using the UKF+FW method. Overall, reducing the FA threshold and adding the FW model both resulted in visually larger AF tracts on the three cases compared to UKFt. In P3, the UKFt+FW method obtained more visually apparent anatomically correct AF fibers (red). In P11 and P22, while tracts obtained using the UFKt+rFA and UKFt+FW methods are visually similar, the UKFt+rFA method introduced more visually apparent false positive fibers (as indicated by the black arrows) than the UKFt+FW method.

