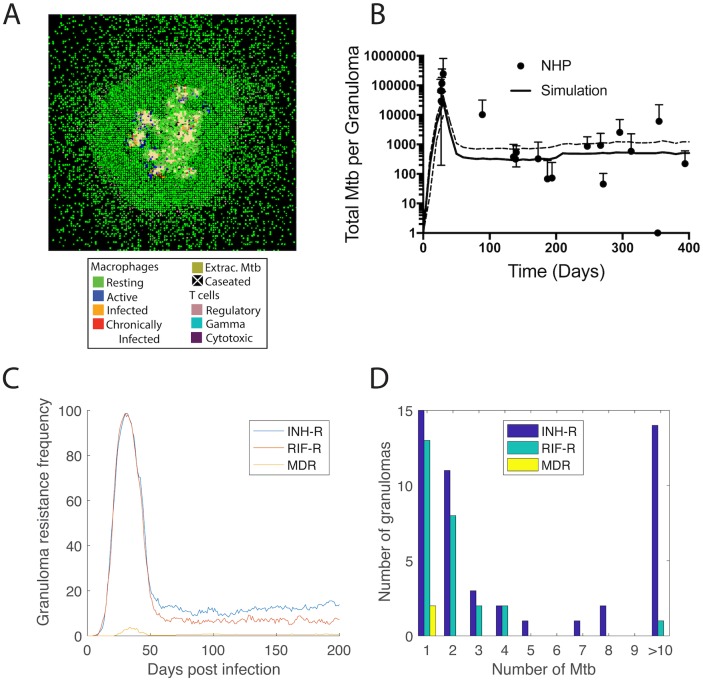
Fig 4. Simulated granuloma dynamics and resistance emergence.
The formation of virtual granulomas is an emergent behavior of the model (A). A representative granuloma is shown 200 days post infection (no antibiotic treatment). Colors indicate the location of macrophage populations (resting, active, infected, chronically infected), T cell populations (regulatory, IFN-γ-producing, and cytotoxic), extracellular bacteria and caseum; (B) GranSim is calibrated to bacterial load dynamics observed in Mtb-infected non-human primates [10]. Solid line shows mean and dashed lines show quartiles for 353 simulated granulomas. Data points and error bars show mean and quartiles of between 3 and 84 non-human primates. (C) The granuloma resistance frequency (Box 1) follows bacterial trajectories, peaking at day 30 and leveling off after 60 days. (D) Granulomas that develop resistance have relatively low numbers of resistant bacteria after 200 days of infection, with a few granulomas having higher numbers of INH-R Mtb (up to 165). Resistance emergence is simulated for mutation rates 3x10⁻⁶ per base pair per day.

