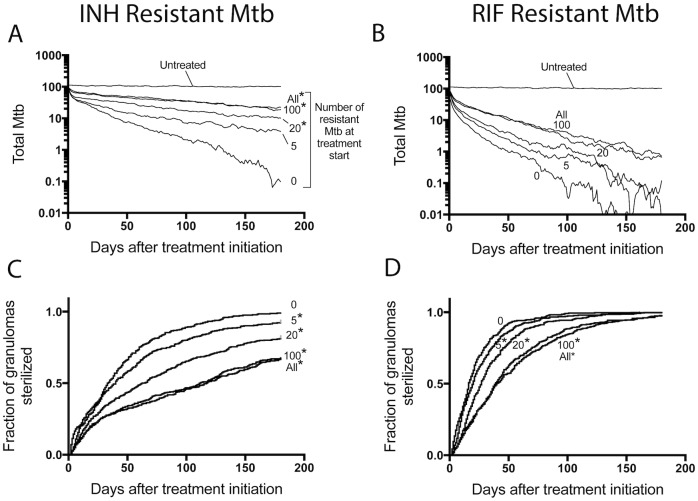
Fig 7. Treatment outcomes under INH- or RIF- monotherapy.
In each simulation, a set number of bacteria are selected to be changed to be resistant. Bacteria are selected from each bacterial sub-population (intracellular, extracellular, non-replicating). We include 0, 5, 20, 100 or ALL resistant Mtb into the simulation prior to treatment. Average bacterial load is shown when adding INH-R Mtb and treating with INH monotherapy in (A) or adding RIF-R Mtb and treating with RIF monotherapy in (B). Panels (C) and (D) contain Kaplan-Meier curves for the same simulations in (A) and (B), respectively, showing the fraction of granulomas that sterilized over time. N = 392 granulomas. *: p < 0.05.

