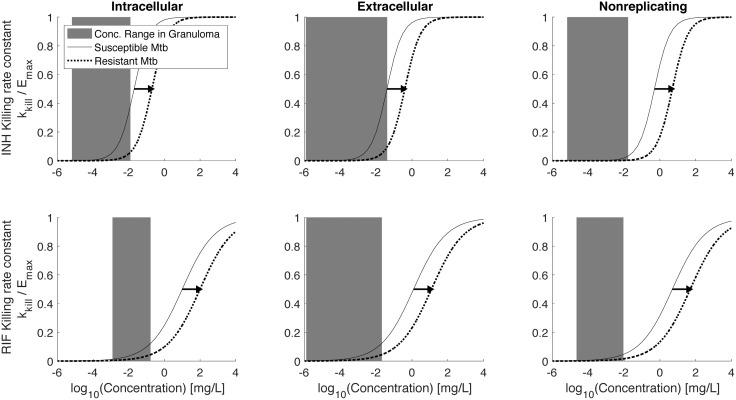
Fig 8. Predicted INH and RIF exposure relative to pharmacodynamic (PD) curves.
Solid lines show relative bacterial killing rate constants (kkill/Emax) as a function of concentration for INH susceptible Mtb (A-C) and RIF susceptible Mtb (D-F). Dotted lines show curves for INH- and RIF-resistant Mtb. Gray bars show the range of concentrations that intracellular (A,D), extracellular (B,E) or non-replicating (C,F) Mtb are exposed to over the first 7 days of treatment.

