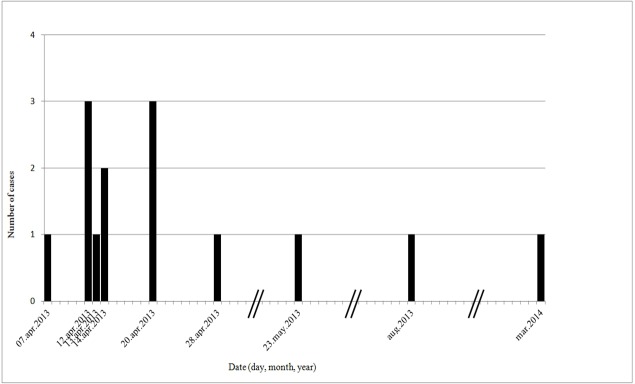
Fig 1. Epidemic curve of the TeHV3 outbreak, April 2013-March 2014.
The curve was built using only the cases having clinical signs, for which it is possible to estimate an exact date of onset of the clinical signs. Bars represent longer periods of time that were cut in the figure. The pattern of the curve, with its irregular trend of cases reflecting the timing and extent of repeated exposures, is consistent with an intermittent source of infection. An estimation of the incubation period was attempted observing the gaps between the peaks of the curve that could represent tortoise-to-tortoise transmission events, followed by a possible incubation period. After the initial period, the outbreak waned, perhaps because of the successful and rapid implementation of control measures.

