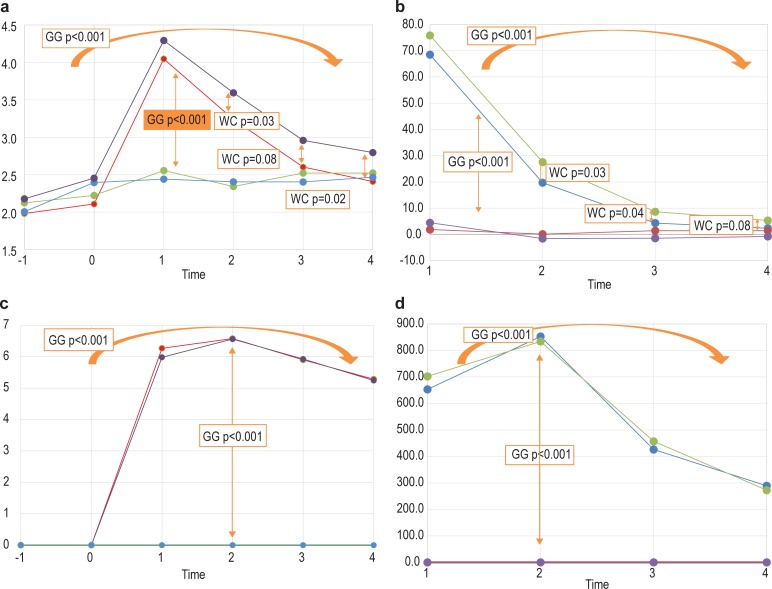
Fig 5. Indications of differences in the average levels of hypoxanthine and sorbitol across the four interventions and six time points.
(a) Differences in the average levels of hypoxanthine from time –1 to time 4 between the four interventions. (b) Differences in the average change in hypoxanthine levels, measured from time 0, following the four interventions. (c and d) The comparative results for sorbitol. Significant differences were based on the Greenhouse–Geisser-corrected p-values from the RM ANOVA model or the Wilcoxon signed-rank tests, assessing differences between the sets of means, and are indicated by the arrows.

