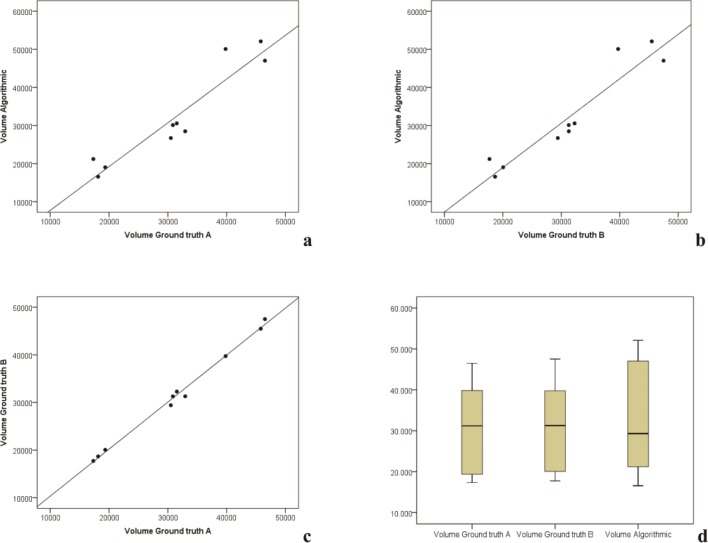
Fig 7.
Regression analysis of volume measurements: Volume measurement distributions are similar along the regression lines between the manual (Ground truth A, B) and GrowCut segmentations (a, b). Moreover volume measurement distributions are closely located along their regression lines when comparing manual and semi-automatic segmentation volumes (a, b, c). Volume measurements of the segmentations are further shown in a boxplot diagram (d), providing nearly equally ground truth segmentation volumes. Difference values between the gradient of the regression lines were not statistically significant (p<0.001). Note: volumes are given mm3 in the tables.

