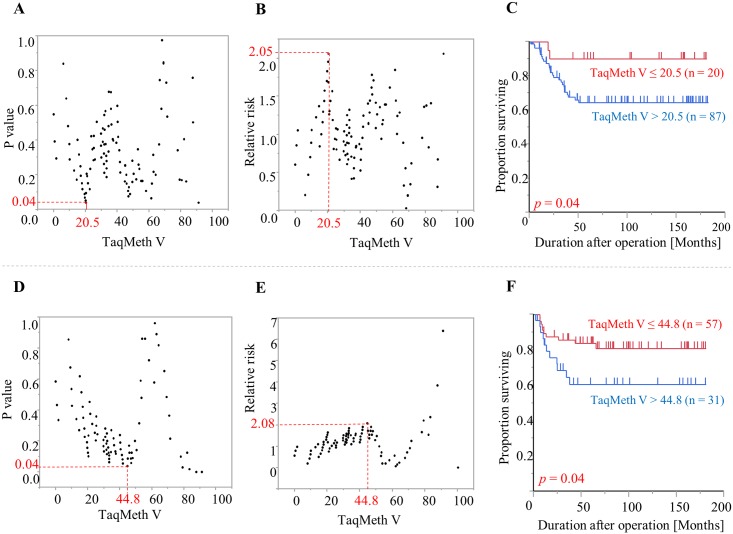
Fig 5. Log-rank plot analysis and Kaplan-Meier survival curves for OS and RFS in CRC patients according to CDO1 TaqMeth V.
A, B: Log-rank plot analysis for OS. C: Kaplan-Meier survival curves for OS comparing CRC patients with CDO1 TaqMeth V equal to or below 20.5 and those with CDO1 TaqMeth V over 20.5. D, E: Log-rank plot analysis for RFS. F: Kaplan-Meier survival curves for RFS comparing CRC patients with CDO1 TaqMeth V equal to or below 44.8 and those with CDO1 TaqMeth V over 44.8.

