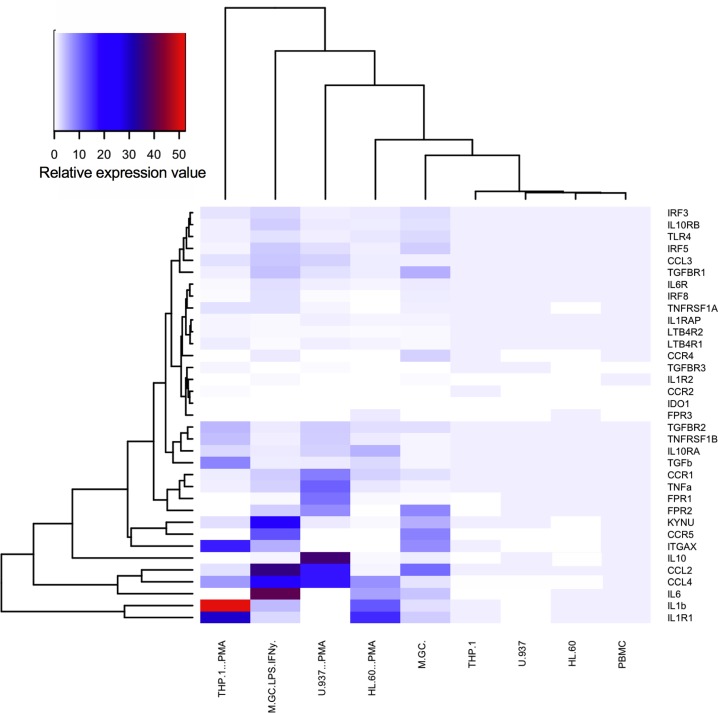
Fig 1. Hierarchical clustered heat map of mean relative expression values for undifferentiated and differentiated CD14+ human peripheral blood mononuclear cells (PBMC, M(GC) and M(GC)LPS/IFNγ) and monocyte-like cell lines (MCLCs ± PMA) including THP-1, U-937 and HL-60s.
PBMCs were differentiated using 10 ng/mL granulocyte-macrophage colony stimulating factor (GM-CSF) for 6 days to give M(GC) and activated using 100 ng/mL LPS and 20 μg/mL IFNγ for 24 h to generate M(GC)LPS/IFNγ. MCLCs were differentiated using 16 ng/mL phorbol-12-myristate-13-acetate (PMA) for 48 h. Data represent n = 3–10; raw data, including the relative expression ± SEM used to generate this heat map, are shown in S2 and S3 Tables. All qPCR data were normalized against both housekeeper genes GAPDH and ACTB2 and the values calculated as described in the Methods. Relative expression values were then calculated versus the relevant non-differentiated cell type. Where no expression was detected a value of 0 was used. Thirty-five genes that encode for inflammatory chemokines, cytokines, adipokines and their relevant receptors were selected as they are associated with inflammation or have been implicated in the development and/or progression of obesity-induced insulin resistance. In addition, small subsets of genes encoding for regulatory factors and enzymatic processes that have been implicated in the pathogenesis of T2DM were profiled. Differential gene expression data were analysed using R version 3.4.1 and hierarchical clustering was performed using complete linkage method with Euclidean distance measure.

