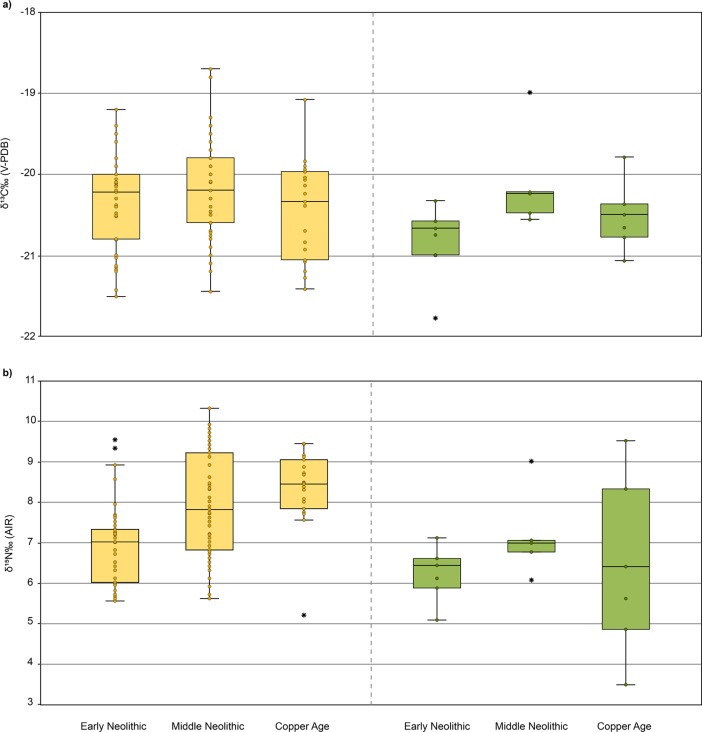
Fig 2.
Boxplot showing the (A) δ13C and (B) δ15N values of fauna samples from Early Neolithic to Copper Age. Faunal data in this study were supplemented by published data of Early Neolithic [42,76], Middle Neolithic [22,25] and Copper Age [25] samples of the GHP. Domesticated fauna results on the left in yellow; wild fauna on the right in green. The dots within the boxes represent individual values of the samples; the horizontal line within the boxrepresents the median value; the vertical lines represent the range of data; and the asterisks are the possible outliers.

