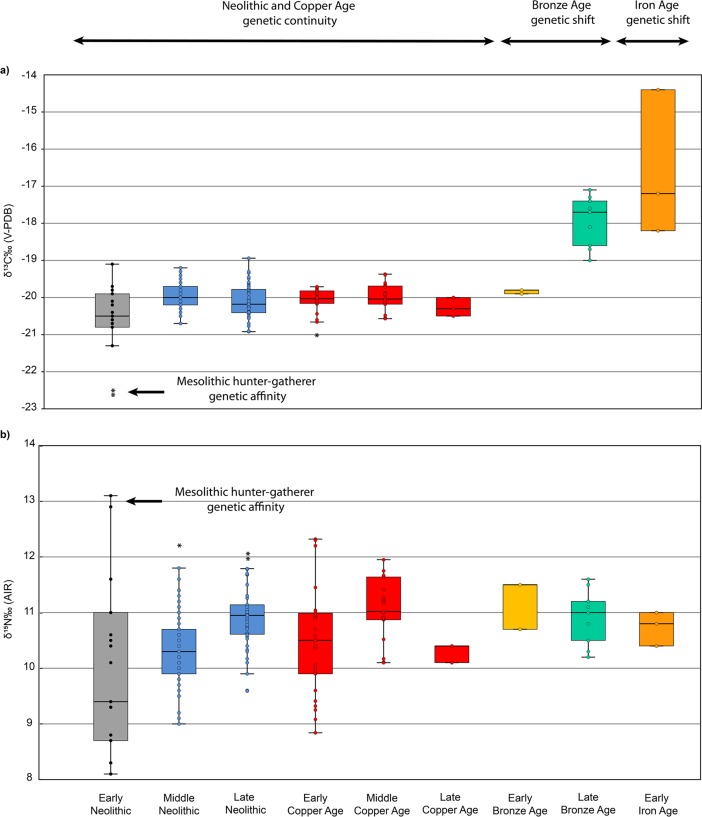
Fig 3.
Boxplot showing the (A) δ13C and (B) δ15N values of human samples from Early Neolithic to Early Iron Age. Human isotopic values were combined with previous published data on the GHP from Early [76], Middle [22,25] and Late Neolithic [25], together with Early and Middle Copper Ages [25]. Genetic affinities are based on [13]. The dots within the boxes represent individual values of the samples; the horizontal line within the box represents the median value; the vertical lines represent the range of data.

