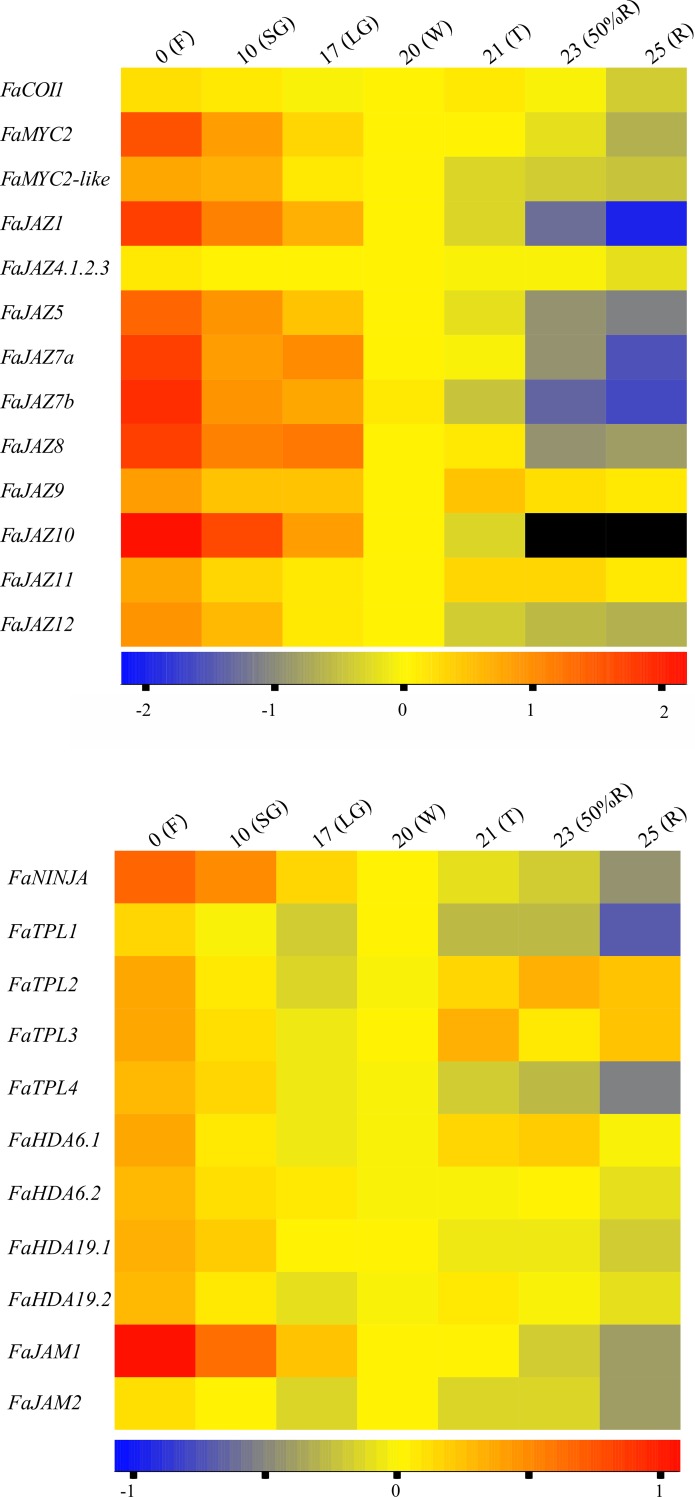
Fig 7. Expression heatmaps of Fragaria × ananassa JA signalling-related genes during fruit development and ripening.
Expression heatmaps of FaCOI1, FaMYCs, FaJAZs (A) and FaNINJA, FaTPLs, FaHDAs, FaJAMs (B). The Log-transformed values of relative expression levels based on RT-qPCR assays were used to perform heatmaps. The color scale represents relative expression levels with red and blue colors as high and low values, respectively. Black means no detection. The expression level of FaGAPDH was used as reference gene to normalize each reaction. The data was from three biological and three technical replicates. Developmental stages correspond to 0 (flowering, F), 10 (small green, SG), 17 (large green, LG), 20 (white, W), 21 (turning, T), 23 (50% red receptacle, 50%R) and 25 (100% red receptacle, 100%R) days after anthesis (DAA) in F. × ananassa cv. Aromas. JAZ, jasmonate ZIM-Domain.

