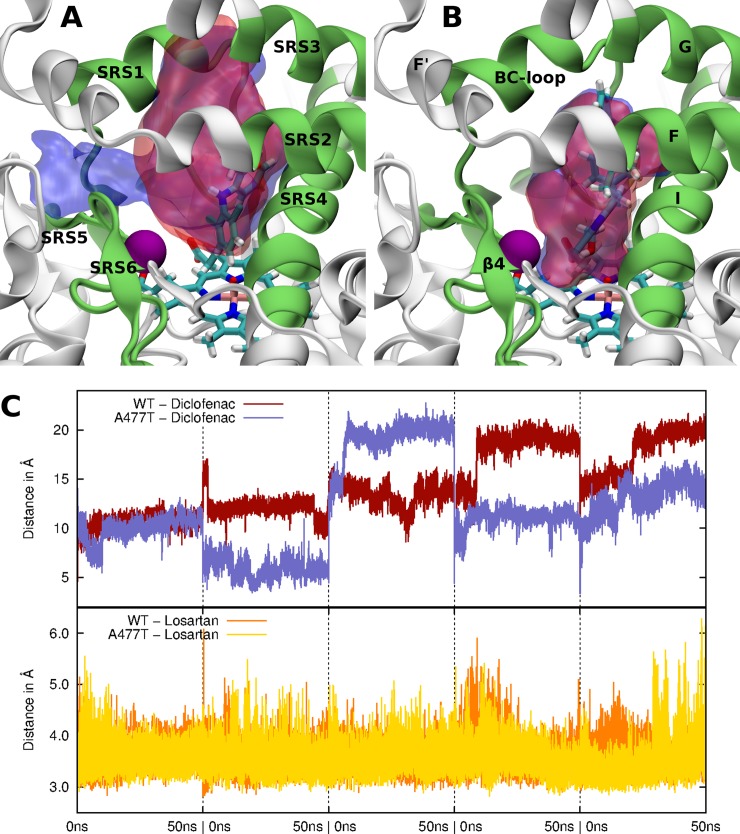
Fig 5. Substrate dynamics during the MD simulations for the WT and the A477T mutant.
Volumetric map of the pocket space explored by diclofenac (A) and losartan (B) during the entire MD simulations are shown. The initial positions of the ligands and Cpd I are shown as sticks. The protein is represented as a white cartoon. SRS regions are colored in green. The purple sphere represents the location of the mutation. The blue (WT) and red (A477T) surfaces represent regions explored by the ligands over 95% of all simulation snapshots. (C) Distance between the Site Of Metabolism (SOM) of diclofenac (top) and losartan (bottom) and the reactive oxygen atom of Cpd I along the MD simulations.

