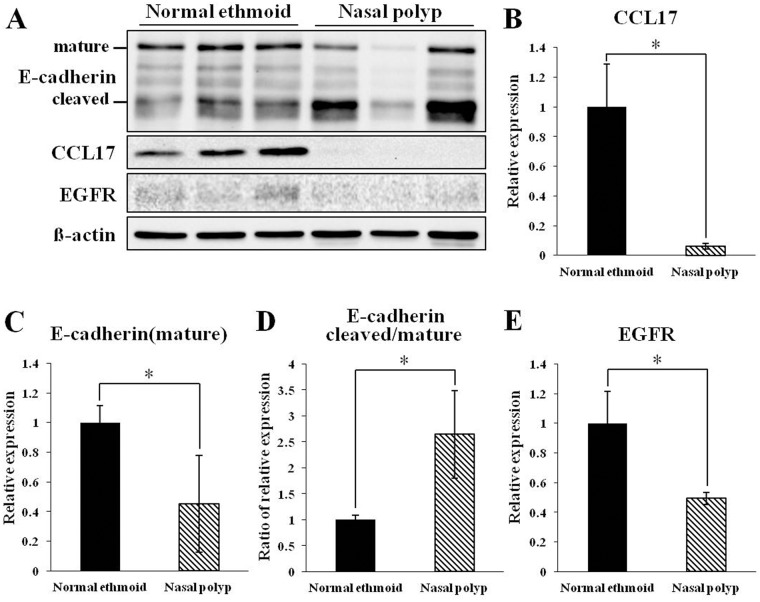
Fig 3. Immunoblotting analysis of E-cadherin, CCL17, and EGFR in epithelial cells from normal ethmoid and nasal polyp cells.
Representative immunoblot images (A) and graphical and statistical analysis of relative CCL17 expression (B), relative mature E-cadherin expression (C), the ratio of cleaved E-cadherin to mature E-cadherin (D), and relative EGFR expression (E). * p<0.05.

