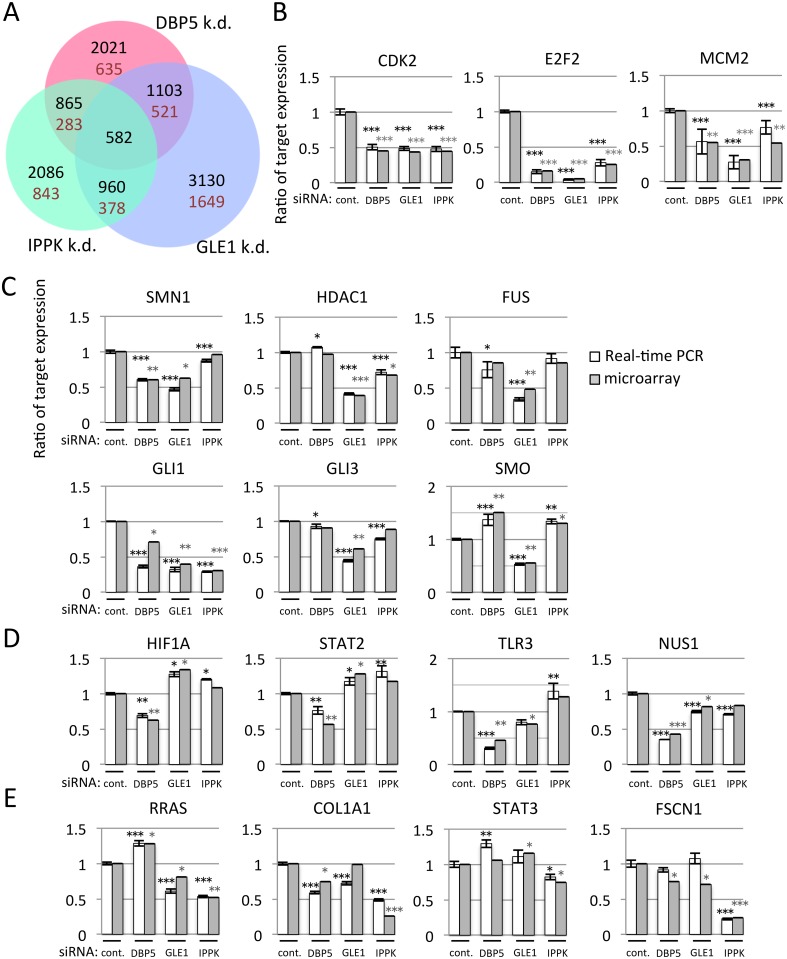
Fig 2. The knock-down of DBP5, GLE1 or IPPK affects the different subsets of cytoplasmic mRNA expressions.
(A) The Venn diagram represents cytoplasmic transcripts reduced at least 1.5-fold in DBP5, GLE1 or IPPK knock-down cells. There were 30,412 probe sets on the array chip. The number in each circle indicates the number of genes detected. Black numbers: number of downregulated genes including overlapped part. Brown numbers: number of downregulated genes except overlapped part. (B-E) Validation of microarray data by real-time PCR. RNA was isolated from cytoplasm of U2OS cells transfected with indicated siRNA. White bar: the detected value of real-time PCR. Gray bar: the detected value of microarray. Each value is the mean with SD of three independent experiments. Error bars represent the SD. p-values were calculated by one-way ANOVA followed by Dunnett’s test by comparison with the control. (*** = p<0.001, ** = p<0.01 and * = p<0.05). (B) The cytoplasmic mRNAs of CDK2, E2F2 and MCM2 were decreased in common among DBP5, GLE1 and IPPK knocked-down cells. (C-E) GLE1, DBP5 and IPPK knock-down decreased the cytoplasmic mRNA. (C) GLE1, (D) DBP5 or (E) IPPK.

