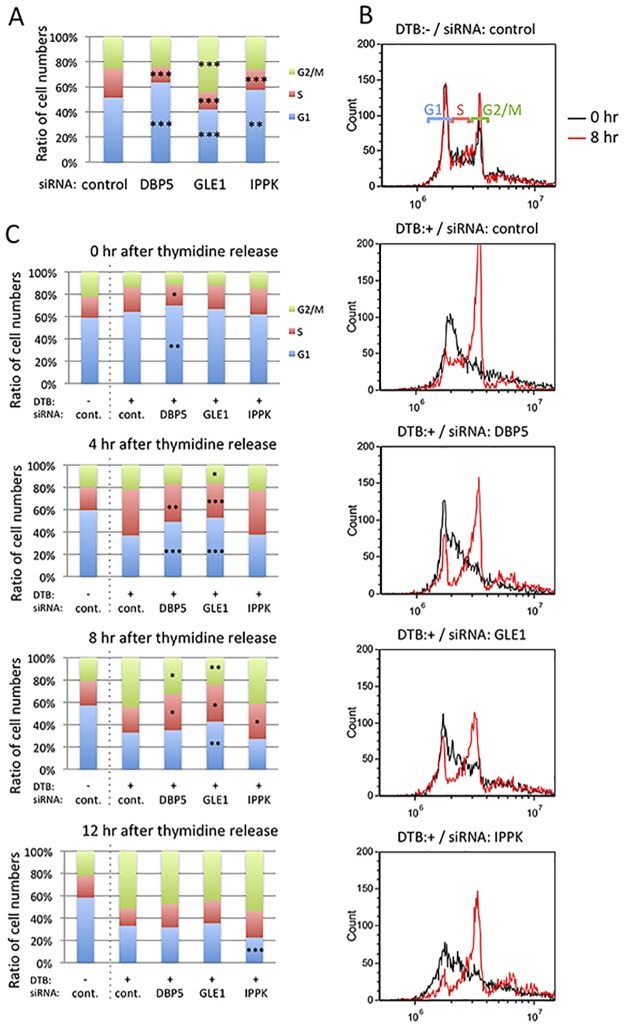
Fig 3. G1/S arrest increases by DBP5 and IPPK knock-down, and G2/M arrest increases by GLE1 knock-down.
(A) The cell cycle phases of DBP5, GLE1 and IPPK knocked-down cells were investigated by flow cytometry. Each value is the mean with SD of three independent experiments. Light green color indicates G2/M phase. Red color indicates S phase. Blue color indicates G1 phase. p-values were calculated by one-way ANOVA followed by Dunnett’s test by comparison with the control. (*** = p<0.001 and ** = p<0.01). (B-C) Comparison among cells transfected with control siRNA without cell cycle synchronization, and cells transfected with control, DBP5, GLE1 or IPPK siRNA in cell cycle synchronization condition by the double thymidine block. DTB: double thymidine block. (B) Histograms show the cell number temporal change of each cell cycle phase. Black line: 0 h after thymidine release. Red line: 8 h after thymidine release. (C) Bar histograms represent the mean of three independent experiments. Light green color indicates G2/M phase. Red color indicates S phase. Blue color indicates G1 phase. p-values were calculated using an unpaired student’s t-test (*** = p<0.001, ** = p<0.01 and * = p<0.05).

