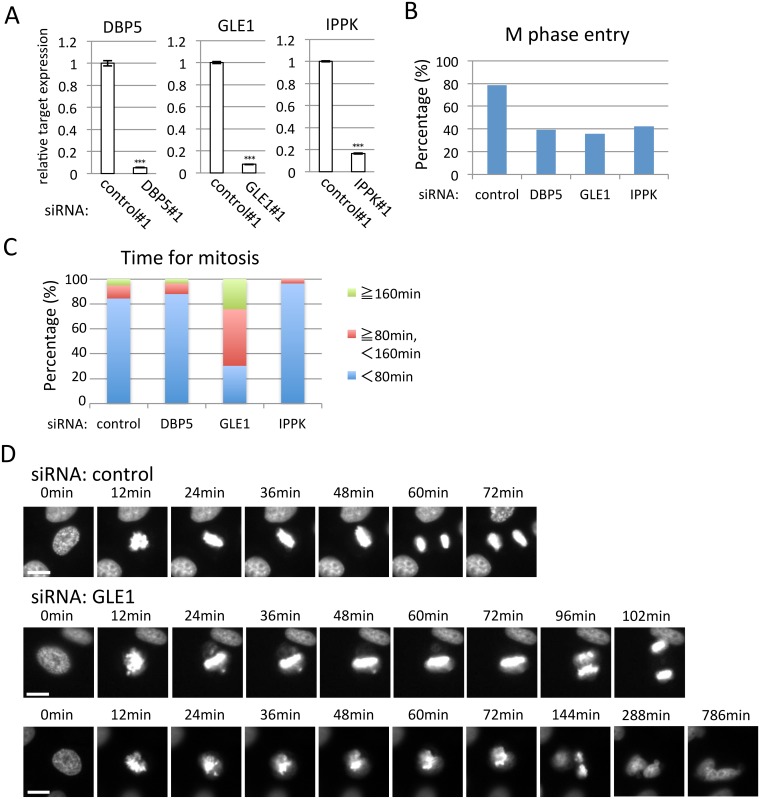
Fig 4. GLE1 knock-down results in mitotic progression defects.
(A) Real-time PCR analysis using HeLa cells expressing H2B-GFP. Transfection of indicated siRNA significantly reduces cytoplasmic mRNA of respective gene. Each value is the mean with SD of three independent experiments. Error bars represent the SD. p-values were calculated an unpaired student’s t-test by comparison with the control. (*** = p<0.001). (B) The ratio of cells that could enter into the M phase during the time-lapse observation. The numbers of cells counted were 111, 66, 75 and 71 in control, DBP5, GLE1 and IPPK siRNA-treated cells, respectively. (C) The percentage of M-phase cells taking more or less than 80 min for mitosis. The numbers of cells counted were 96, 33, 58 and 28 in control, DBP5, GLE1 and IPPK siRNA-treated cells, respectively. (D) Representative successive live cell images for the indicated siRNA-transfected cells. Cells were observed 40–57 h after siRNA transfection, and the time was measured from M-phase progression by analyzing the recordings. Scale bar, 20 μm.

