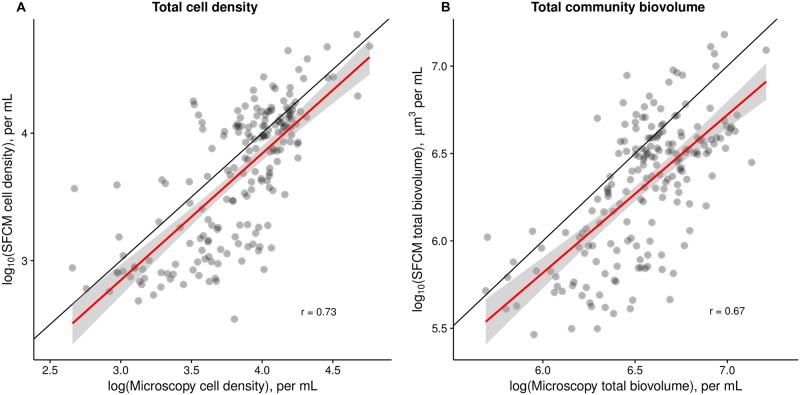
Fig 3. Whole-community cell density and biovolume estimates are quantitatively similar when measured by SFCM and microscopy.
Estimates of whole-community cell density and biovolume by SFCM are strongly correlated with those by microscopy (on the log scale), and are quantitatively similar. Each point represents a single depth-specific sample measured using both methods. The black line is the 1:1 line and the red line represents the regression relationship. A) Cell density estimates are strongly correlated (r = 0.73, p<0.001). B) Whole-community total biovolume estimates are strongly correlated (r = 0.67, p<0.001). The slope of the regression is indistinguishable from the expected value of 1 (mean = 0.90, CIs: 0.76, 1.05) and the intercept is indistinguishable from the expected value of 0 (mean = -0.40, CIs: -0.54, 1.33).

