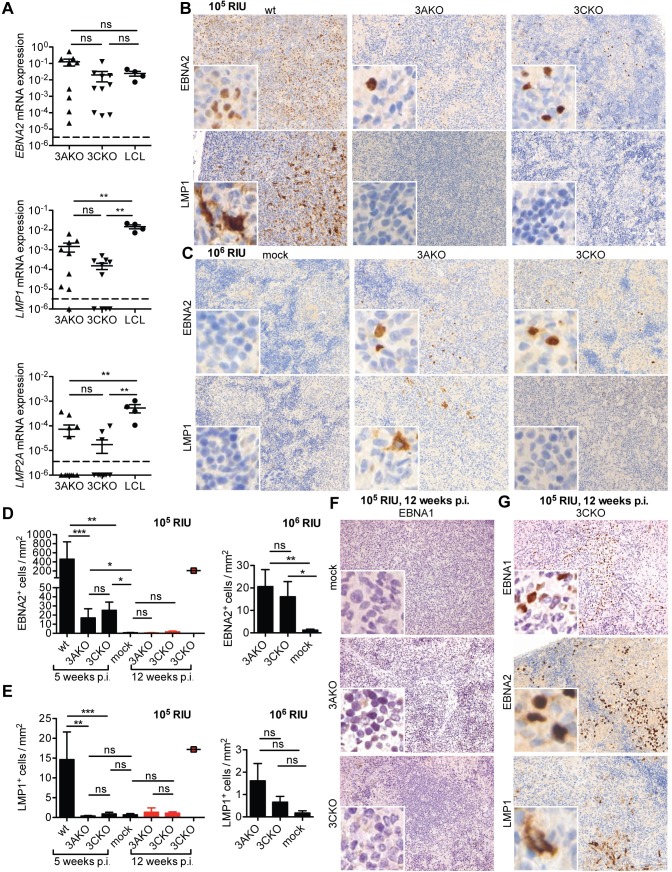
Fig 5. EBNA3A and EBNA3C deficient EBV persist without viral protein expression.
(A) Relative EBNA2, LMP1 and LMP2A mRNA expression normalized to GAPDH in purified splenic B cells from huNSG mice infected with 106 RIU of 3AKO or 3CKO 6 weeks p.i. (n = 9-12/group) and LCL from 4 different donors. The horizontal dashed lines indicate the detection limits of the RT-qPCR assays. Values for mice in which no LMP1 transcripts were detected are plotted on the X-axis. (B, C, G) Staining for EBNA2 ((B, C) upper column, original magnification, 200x) or LMP1 ((B, C), lower column, original magnification, 200x) and (D, E) the quantification of EBNA2+ or LMP1+ cells/mm2 in splenic section of huNSG mice infected with either (B, D, E) 105 RIU of wt, 3AKO or 3CKO 5 weeks p.i. (n = 17-20/group) indicated by black bars, (D, E, G) 105 RIU of 3AKO or 3CKO 12 weeks p.i. (n = 3-5/group) indicated by red bars/square or (C-E) 106 RIU of 3AKO or 3CKO 6 weeks p.i. (n = 11-13/group) or non-infected control (mock) huNSG mice. (F, G) Staining for EBNA1 (original magnification, 200x) in splenic sections of huNSG mice infected with 3AKO or 3CKO 12 weeks p.i. or non-infected control (mock) huNSG mice. (A, D, E) Pooled data from 4 and 2 experiments represented with the mean ± SEM, **P < 0.01, ***P < 0.001, Mann-Whitney U test.

