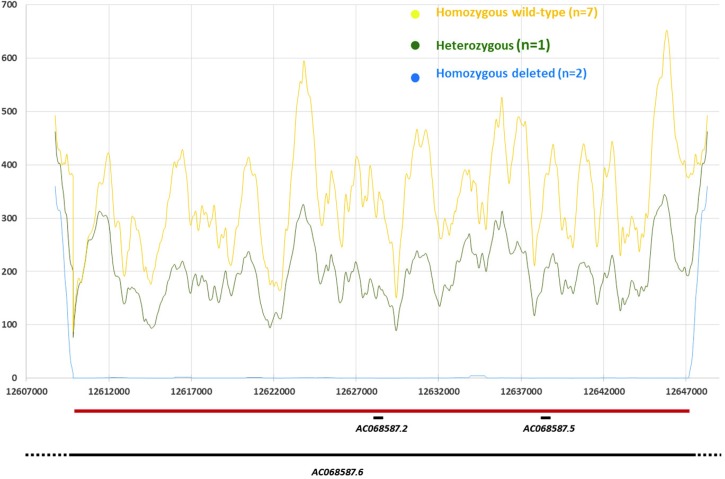
Fig 4. Distribution of the mean coverage per base in the 8q32 deletion region according to the deletion status.
Zoom out of the deletion region (Chr8:12,607,000–12,647,000). Positions in base pair (bp) are given on the x-axis. Y-axis displays the mean coverage per base as estimated through 1kb sliding windows (i.e. value at position X is the mean over X +/- 500 bp; note for X<1kb mean is over X + 1kb). Custom tracks shows the delineated deletion (Chr8:12,609,841–12,647,341—horizontal red bar), and the genes reported from the Vega database as implemented in the Ensembl genome browser (horizontal black lines): AC068587.6 (Ensembl gene ID: ENSG00000283674); AC068587. 2 (ENSG00000244289); AC068587.5 (ENSG00000255253).

