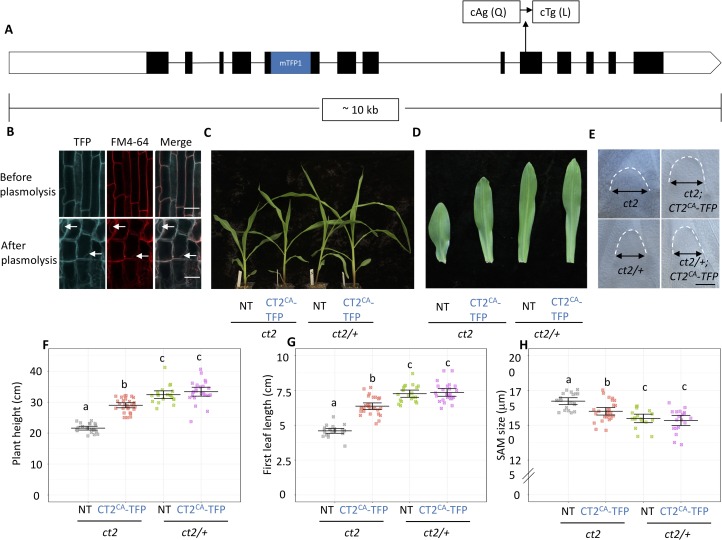
Fig 2. Expression of CT2CA-mTFP1 partially complemented the vegetative growth of ct2 mutants.
(A) The CT2CA-mTFP1 construct in a native context of the CT2 genomic region. (B) CT2CA-mTFP1 was co-localized with FM4-64 on the plasma membrane, scale bar = 50 μm. Expression of CT2CA-mTFP1 partially complemented the ct2 dwarf phenotype (C and F), the leaf length phenotype (D and G), and the enlarged SAM size phenotype (E and H), scale bar = 100 μm. NT, non-transgenic control. The raw values are shown in (F-H), the horizontal black lines indicate the means, and the error bars represent 95% confidence intervals; for (F and G) n = 21, 28, 20, and 24, respectively; for (H) n = 20, 27, 18, and 20, respectively. Data were analyzed using ANOVA followed by the LSD test. The groups containing the same letter are not significantly different at the p-value of 0.05.

