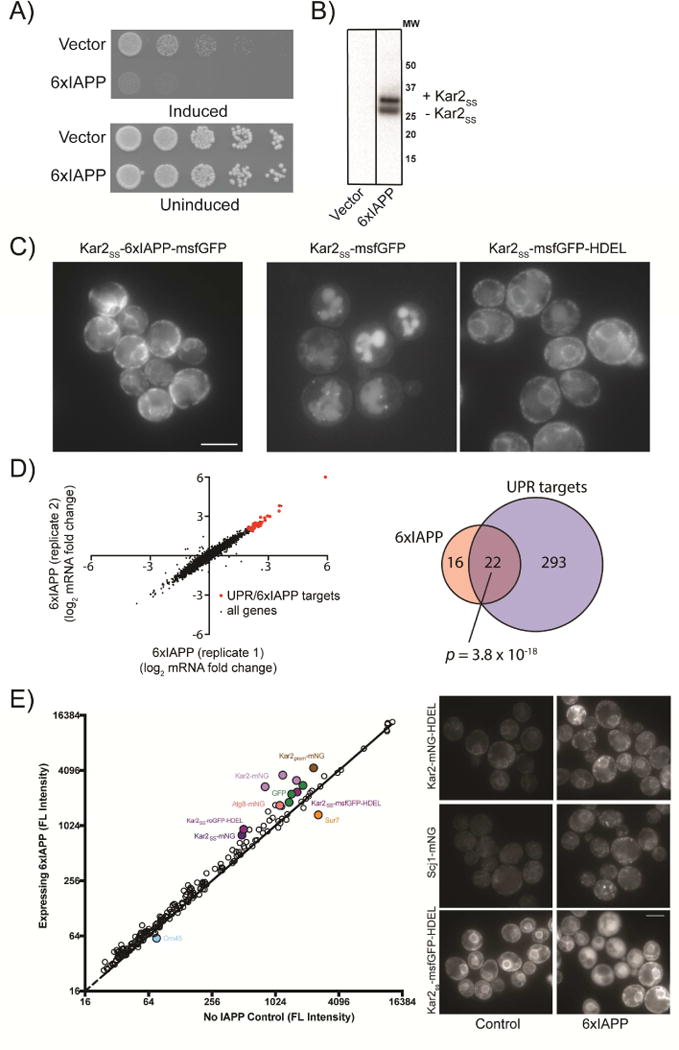
Figure 1. Growth defects and ER stress in yeast expressing 6xIAPP.

A) Yeast harboring empty vector or 6xIAPP were induced with 100 nM estradiol and grown on agar plates for 24 hrs. B) Western blot of cells expressing 6xIAPP. C) Cells expressing 6xIAPP-msfGFP fused to a Kar2 signal peptide (Kar2SS) (panel 1), msfGFP fused to Kar2SS (panel 2), and msfGFP fused to Kar2SS and an ER retention peptide (HDEL) (Panel 3). Scale bar = 5 μm. D) RNAseq data from 2 biological replicates of strains harboring a single copy of 6xIAPP. In red are genes upregulated in both the IAPP strains and in the unfolded protein response. The Venn diagram shows the genes typically upregulated in the UPR (blue) and those upregulated >4 fold when 6xIAPP was expressed (pink). The overlap between the two sets is shown in dark pink, along with the p-value calculated using Fisher’s exact test. E) Mean GFP intensity comparison across all fluorescent reporter strains for cells expressing 6xIAPP and controls. The solid line represents equal GFP expression. Filled circles are reporter strains with large intensity changes upon 6xIAPP expression. The most highly perturbed strains (Kar2ss-GFP-HDEL, Scj1-mNG, Kar2-mNG-HDEL) were measured independently and are shown on the right. Scale bar = 5 μm. See also Figure S1.
