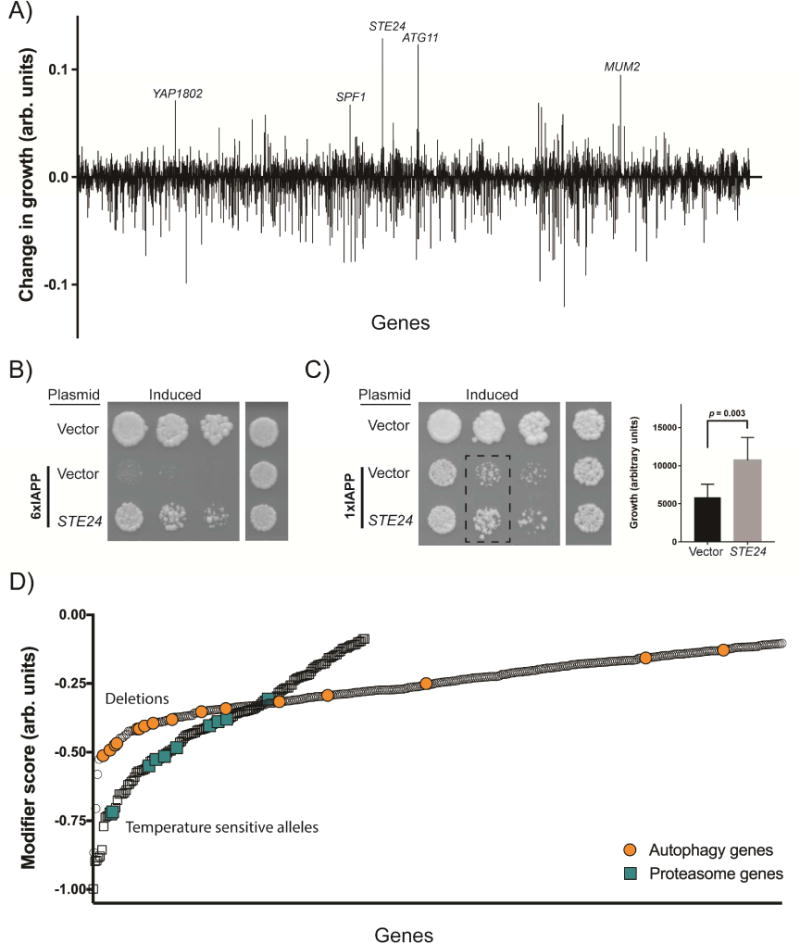
Figure 2. Genome-wide screens for modifiers of IAPP toxicity.

A) The suppressors and enhancers recovered from the overexpression screen, highlighting the strongest suppressors. A positive score indicates a suppressor of toxicity, while a negative score indicates an enhancer of toxicity. B) Spotting assays demonstrating independent verification of the Ste24 suppressor on both the 6xIAPP and C) 1xIAPP yeast models. 6xIAPP strains and uninduced 1xIAPP strains were grown for 48 hours. The induced 1xIAPP strains were grown for 72 hours. The bar chart is a quantification of the 1xIAPP dilution assay (dashed rectangle) with cells co-overexpressing control vector represented by the black bar (n=6) and cells co-overexpressing STE24 represented by the gray bar (n=9). Statistical analysis was performed using Student’s t-test. D) The enhancers of toxicity recovered from the genome wide deletion of non-essential genes (circles) and temperature-sensitive allele screen of essential genes (squares). A more negative score indicates a stronger enhancer of toxicity. The enrichment for autophagy genes (orange circles) and proteasome genes (turquoise squares) among the enhancers is highlighted. See also Figures S2, S3, and Tables S1-S3.
