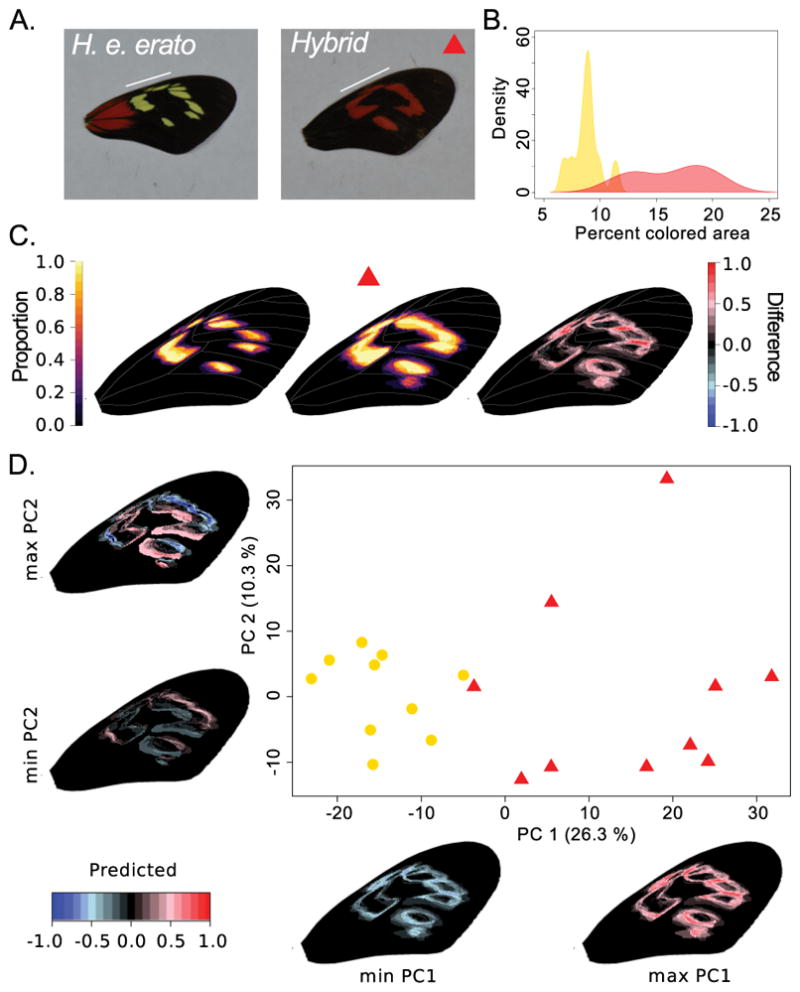
Fig. 3.

Example of image registration and threshold color extraction in the forewing band area of Heliconius erato erato (n = 10) and hybrid (n = 10) butterflies (French Guiana). (A.) Example of original images with a white line indicating the forewing band area. The hybrid represents a naturally occurring backcross in a hybrid zone with H. e. hydara (see Fig. 1) that results in red color expression in the forewing band. (B.) Density plot showing the probability to find a sample with a certain percentage of colored area in the wing expressing yellow in H. e. erato and red in the hybrid. (C.) Visualizing the variation in color pattern expression in a heatmap shows a consistently larger pattern in the hybrid phenotypes (H. e. erato: left, hybrid: middle, hybrid minus H. e. erato: right). (D.) Principal component analysis (PCA) confirms that the main axis of variation (PC1) is related to size of the pattern (yellow or red in H. e. erato and hybrids, respectively) and separates the H. e. erato and hybrid samples. The second principal component (PC2) axis highlights more complex shape differences in the forewing band among the samples as demonstrated by the shape changes of the color patterns along the principal component axis.
