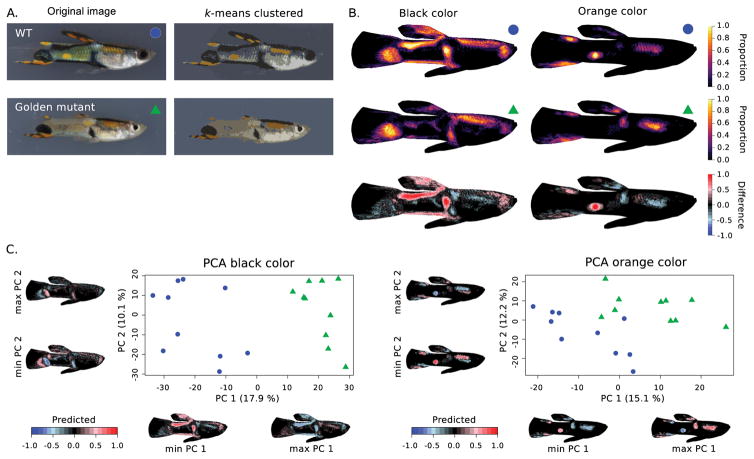
Fig. 4.
Example of image registration and k-means clustering of colors in guppies (Poecilia reticulata). (A.) Original image of a wild type (WT) and golden mutant guppy and their k-means clustered representation (clusters = 7). (B.) Heatmaps and difference between WT (n=10) and golden mutant (n=10) for black and orange color clusters. (D.) PCA analysis of the pixel matrices obtained for the black (left) and orange (right) color clusters. Images were obtained with permission from Kottler et al. (2013).

