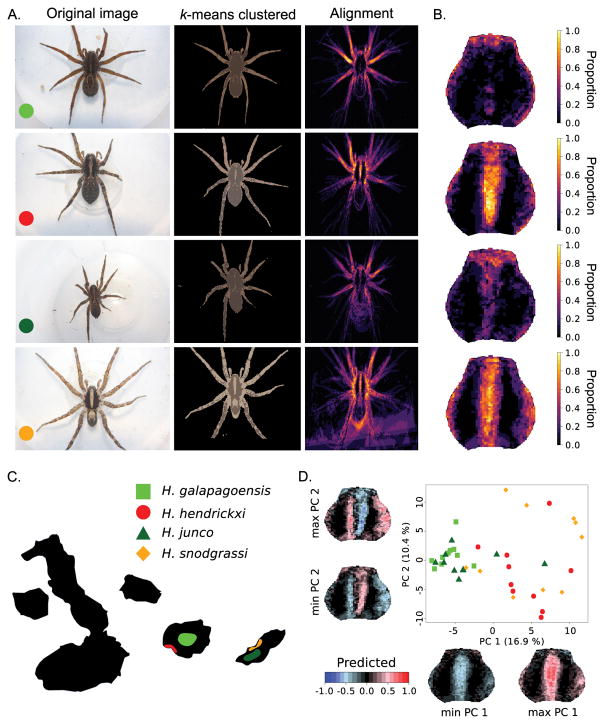
Fig. 5.
Example of image registration and k-means clustering of the color pattern of Galápagos wolf spiders (Hogna). (A.) From left to right: example of original image (10 images were used for each species), k-means clustered image (k = 3) with removed background, and alignment of the lightest color. (B.) Heatmap corresponding to the lightest color cluster focused on the carapace. (C.) Map of the Galápagos islands with colors indicating the distribution of four Hogna species, two high elevation species (light and dark green) and two coastal species (red and orange). (D.) PCA analysis of the pixel matrices obtained for the lightest color cluster demonstrates that the coastal (H. hendrickxi and H. snodgrassi) and high-elevation (H. galapagoensis and H. junco) species cluster phenotypically together and share, respectively, the presence and absence of a pale median band on their carapace. Images were obtained with permission from De Busschere et al. (2012).

