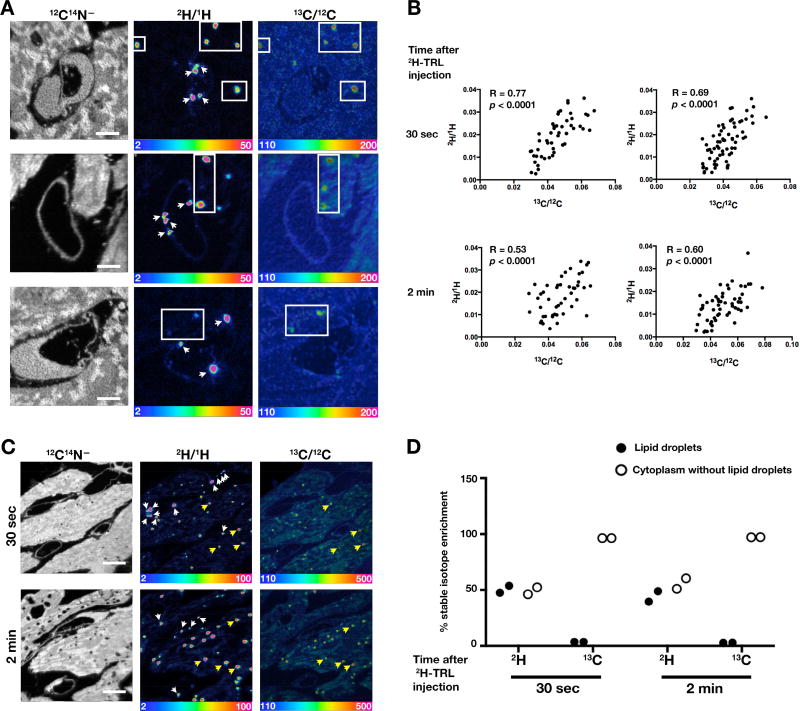
Figure 5. NanoSIMS Images of Heart Tissue from Mice That Had Been Given [13C]Fatty Acids by Gastric Gavage and on the Following Day an Intravenous Injection of 2H-TRLs.
[13C]Fatty acids were administered to 3–4-month-old female wild-type mice by gastric gavage (two 80-mg doses 12 h apart). Twenty-two h after the second dose, mice were fasted for 4 h and then injected with 200 µl of 2H-TRLs containing 40 µg triglycerides. Thirty sec or 2 min after the injection, the mice were euthanized and perfusion-fixed with carbodiimide/glutaraldehyde; sections of heart were prepared for NanoSIMS imaging. Two mice were used in this experiment, one for each time point.
(A) NanoSIMS images of heart tissues 30 sec after the injection of 2H-TRLs. 12C14N− images were useful for morphology; 2H/1H ratio images revealed marginated 2H-TRLs in capillaries (white arrows) and 2H-enriched lipids in lipid droplets of cardiomyocytes (boxed regions). 13C/12C ratio images show 13C distribution. 2H/1H and 13C/12C ratio scales are multiplied by 10,000. Scale bar, 2 µm.
(B) Scatter plots comparing 2H/1H and 13C/12C ratios in the center of cardiomyocyte lipid droplets. Data were obtained from lipid droplets (n = 50–60) in two NanoSIMS images (31 × 31 µm).
(C) NanoSIMS images showing 2H enrichment in marginated lipoproteins in capillaries (white arrows) and cardiomyocyte lipid droplets (several indicated by yellow arrows). 12C14N− images show tissue morphology; 2H/1H ratio images show the distribution of 2H 30 sec or 2 min after the injection of 2H-TRLs; 13C/12C ratio images show 13C distribution one day after giving 13C-labeled fatty acids by gastric gavage. The same lipid droplets were identified in both 2H/1H and 13C/12C images. 2H/1H and 13C/12C ratio scales are multiplied by 10,000. Scale bar, 5 µm.
(D) Plot depicting the percentage of cellular 2H and 13C in cytosolic lipid droplets, relative to 1H and 12C, respectively (two 35 × 35-µm NanoSIMS images analyzed at each time point). See also Figure S3.

