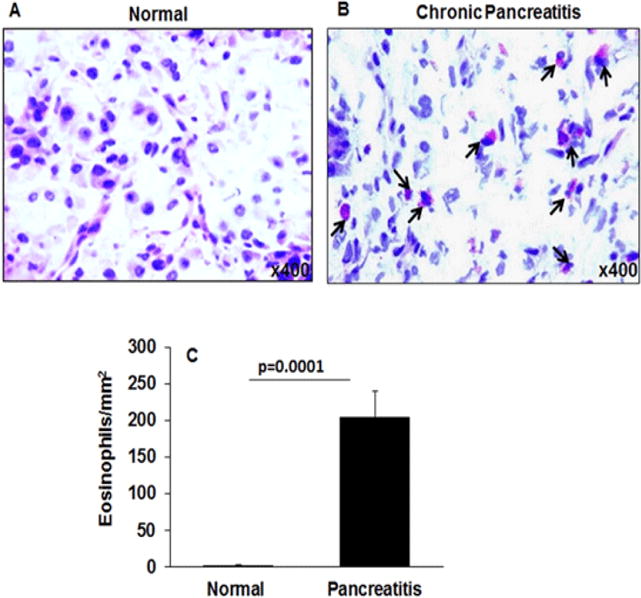
Figure 1. Analysis of eosinophils in human pancreatitis tissue.

Representative H & E stained photomicrograph of a tissue section of normal pancreas (A) and pancreatitis patients’ tissue (B) showing accumulated eosinophils in pancreatitis tissue sections marked with black arrows. Eosinophils in the pancreatic tissue sections were quantitated and expressed as eosinophils/mm2 (C). Data presented as mean ± SD, n = 3 for normal individuals, and n = 3 for pancreatitis patients. Representative photomicrograph presented as ×400 of original magnification.
