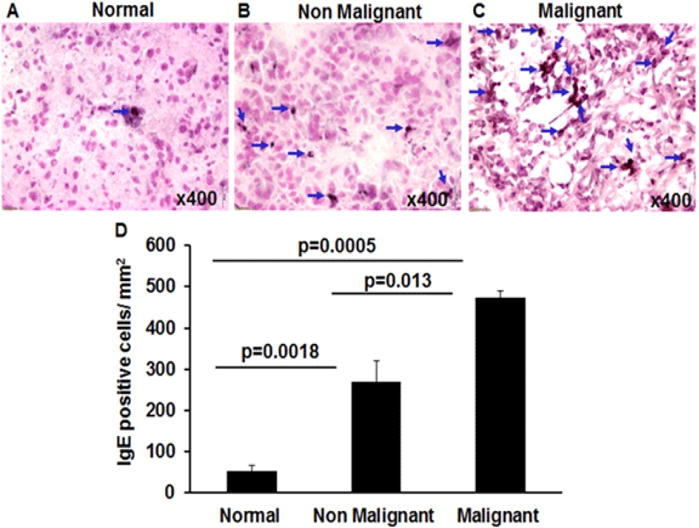
Figure 4. Tissue specific IgE analysis in normal, malignant and non-malignant pancreatic patients.

Human anti-IgE immunostaining was performed to detect IgE producing cells in tissue sections of normal, malignant, and non-malignant tissue sections. The large number of anti-IgE positive cells was detected in non-malignant and malignant pancreatic tissue sections compared to very few numbers in normal pancreas tissue sections (A–D). A significant increase in IgE positive cell was also observed in malignant pancreatic tissue sections compared to non-malignant tissue sections (B, C). Blue arrows mark IgE positive cells. The morphometric quantitation of IgE positive cells is shown as IgE positive cells/mm2 (D). Representative photomicrographs presented as ×400 of original magnification. The quantitative data are expressed as mean± S.D, n=3 for normal and n = 4 for malignant and n=3 non-malignant patient.
