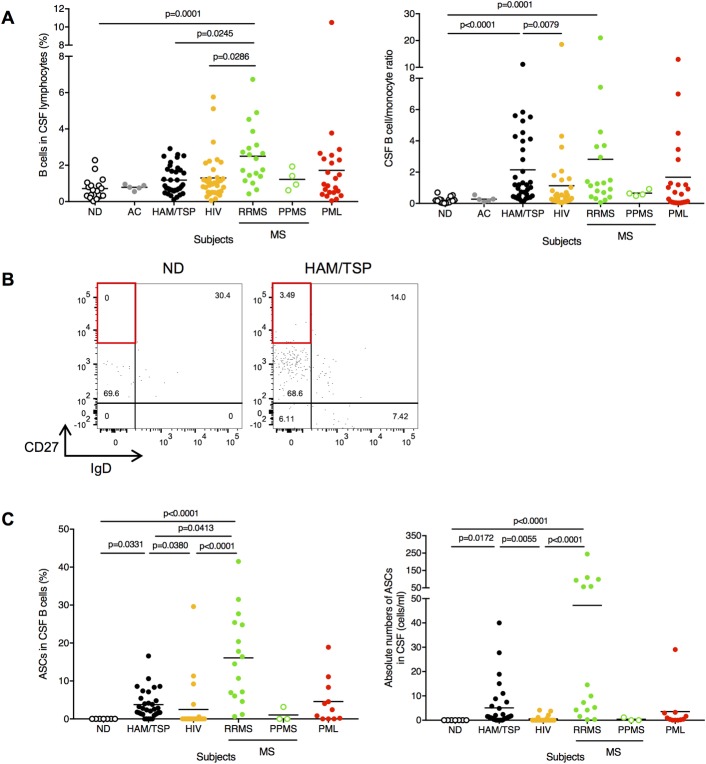
Fig 1. Detection of B cells in CSF of chronic virus infection and/or neuroinflammatory diseases.
(A) Comparison of frequencies of B cells (left) and B cell/monocyte ratio (right) in CSF using Kruskal-Wallis test with Dunn’s test. The horizontal line represents the mean. (B) Detection of ASCs subset in B cells of CSF. (Left) Representative dot plots of IgD and CD27 staining in CSF CD19+ B cells of a ND and a HAM/TSP patient. IgD- CD27++ subsets (red rectangles) represent ASCs. (C) Comparison of frequencies of ASCs (left) and absolute number of ASCs (right) in CSF using Kruskal-Wallis test with Dunn’s test. The horizontal line represents the mean.

