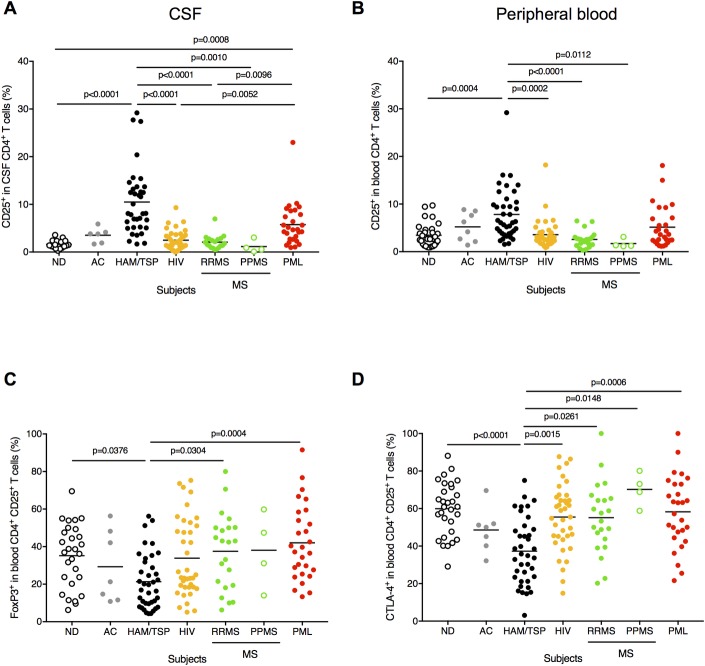
Fig 4. Detection of CD4+CD25+ T cells in CSF of chronic virus infection and/or neuroinflammatory diseases.
(A) Comparison of frequency of CD4+CD25+ T cells in CSF using Kruskal-Wallis test with Dunn’s test. The horizontal line represents the mean. (B) Comparison of frequency of CD4+CD25+ T cells in peripheral blood using Kruskal-Wallis test with Dunn’s test. The horizontal line represents the mean. (C) Comparison of frequency of FoxP3 in peripheral blood CD4+CD25+ T cells using Kruskal-Wallis test with Dunn’s test. The horizontal line represents the mean. (D) Comparison of frequency of CTLA-4 in peripheral blood CD4+CD25+ T cells using Kruskal-Wallis test with Dunn’s test. The horizontal line represents the mean.

