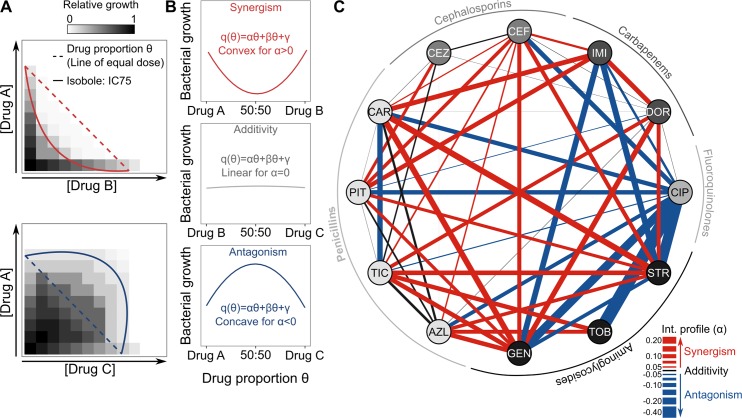
Fig 1. Drug interaction network for P. aeruginosa.
(A) Schematic representation, adapted from [17], of the principle underlying the drug proportion parameter θ (line of equal dose; dashed lines), which is subsequently used to determine drug interactions, in comparison to different shapes of isobolograms (solid lines), as observed in synergistic (in red; top panel) or antagonistic (in blue; bottom panel) interactions. (B) Schematic illustration of the different interaction types as a function of the drug proportion parameter θ, ranging from synergism to antagonism. Drugs are combined in 9 different proportions (n = 9 for each combination), with each drug alone set to inhibit 75% of growth (S1 Fig). After a fixed time (12 h), bacterial growth is measured, and a quadratic model is used to fit the observed data. The α test [17] was used to determine significance of synergism or antagonism (S1 Table). (C) The α parameter was inferred from measured data to reconstruct a drug interaction network including 52 different antibiotic combinations. Combinations were formed from 12 different drugs, here represented as the nodes of the network, spanning 5 different antibiotic classes (see outer ring). The drug interaction profile is shown through the links (lines) formed between the nodes, and its strength is highlighted by the thickness of the lines and color. Red, black, and blue lines correspond to synergistic, additive, or antagonistic interactions, respectively (see also S3 Fig). The data for this panel are provided in S3 Data. AZL, azlocillin; CAR, carbenicillin; CEF, cefsulodin; CEZ, ceftazidime; CIP, ciprofloxacin; DOR, doripenem; GEN, gentamicin; IC75, concentration inhibiting 75% of bacterial growth; IMI, imipenem; PIT, piperacillin + tazobactam; STR, streptomycin; TIC, ticarcillin; TOB, tobramycin.

