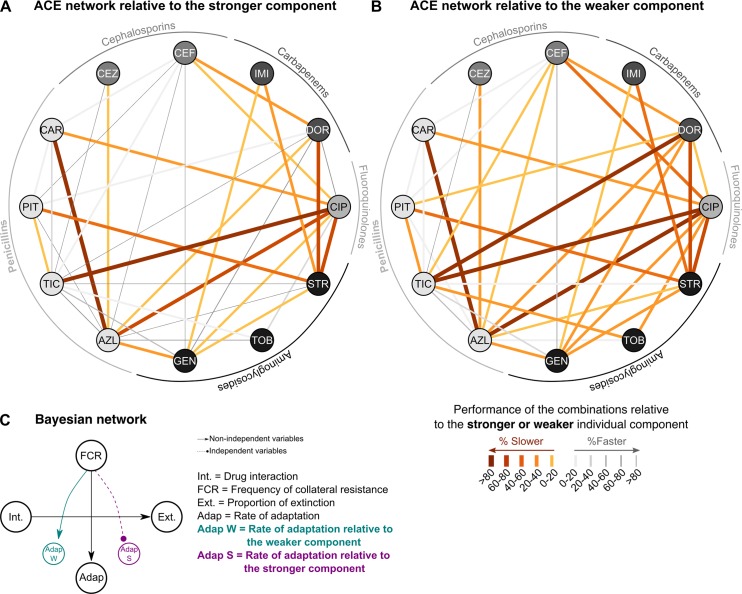
Fig 6. Weighted ACE networks and their Bayesian analysis.
We assessed to what extent adaptation to one of the drugs of a pair determined the overall rate of adaptation to the combination treatment. The stronger component drug of each pair was identified as the one with lower adaptation rates in monotherapy. We subsequently standardized the adaptation rates towards the combination by those towards either (A) the stronger or (B) the weaker component drug, resulting in 2 weighted ACE networks. Orange thick lines indicate slower adaptation, while grey thin bands denote fast adaptation. (C) Results of the BN analysis on the original network versus the 2 standardized networks. The relationship between drug interaction type and extinction frequency was stable across all analyses, while the dependence of adaptation rate on evolved collateral effects disappeared when adaptation rates were standardized by the stronger component. Adaptation rates are inferred from the data on growth characteristics during experimental evolution, provided in S4 Data. ACE, antibiotic combination efficacy; AZL, azlocillin; BN, Bayesian network; CAR, carbenicillin; CEF, cefsulodin; CEZ, ceftazidime; CIP, ciprofloxacin; DOR, doripenem; GEN, gentamicin; IMI, imipenem; PIT, piperacillin + tazobactam; STR, streptomycin; TIC, ticarcillin; TOB, tobramycin.

