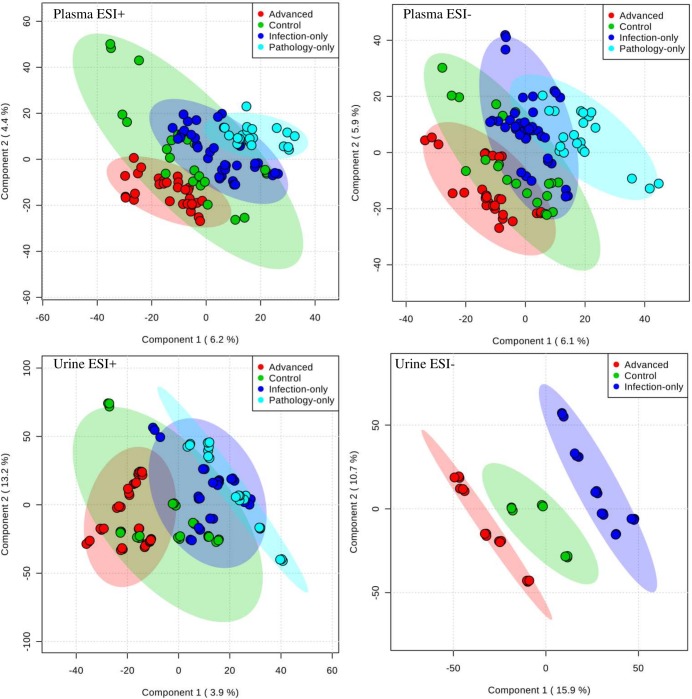
Fig 2. Urine and plasma samples have different separation patterns in different states of urogenital schistosomiasis and induced pathologies.
Separation patterns were drawn with PLSDA score plots of mass spectral data. Spectral data was captured for urogenital schistosomiasis induced-pathology cases (Advanced), urogenital schistosomiasis alone (Infection-only), pathology with no detectable urogenital schistosomiasis (Pathology-only) and Controls. The plots show that statistically, the various study groups can be defined independently using their metabolite component. ESI is electrospray ionization.

