
Figure 2.
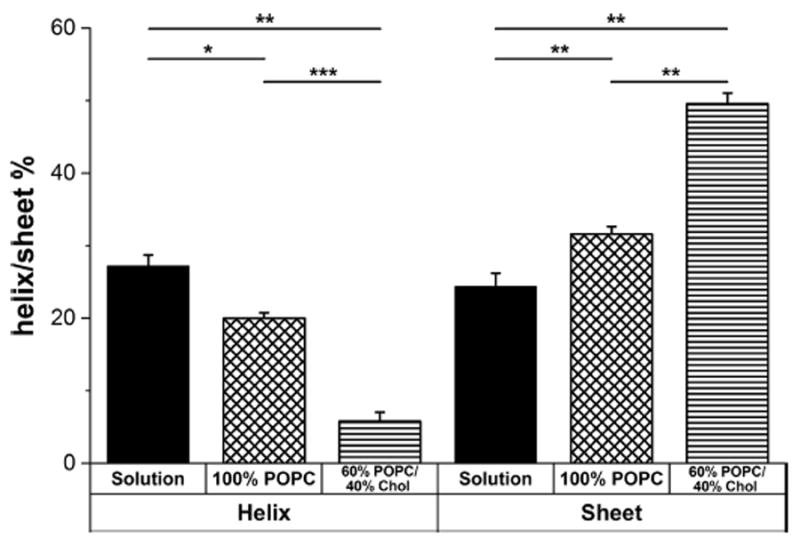
Predicted secondary structure of CRAC336WT in solution or in membranes composed of either 100% POPC or 60% POPC and 40% Chol, determined with DICHROWEB using CONTIN/LL and the SP175 or SMP180 reference set. The bar graph is split into an α-helical structure section (left) and a β-sheet structure section (right). Each bar graph represents data averaged over three independent experiments. The level of significance was determined using an unpaired two-sample t test. ***P ≤ 0.001; **P ≤ 0.01; *P ≤ 0.05; NS, P > 0.05.